REVERSAL LONG------- this pattern requires that i ensure there is no DILUTION involved with the stock. The naunce of this pattern is great in that less people playing the pattern makes the pattern more effective, however i must first scan for this pattern to see the frequency rate at which it occurs. Then i can consider playing it. But it isn't one of the main patterns, thus stay clear from it until i accumulate more capital (at least $50k or so).
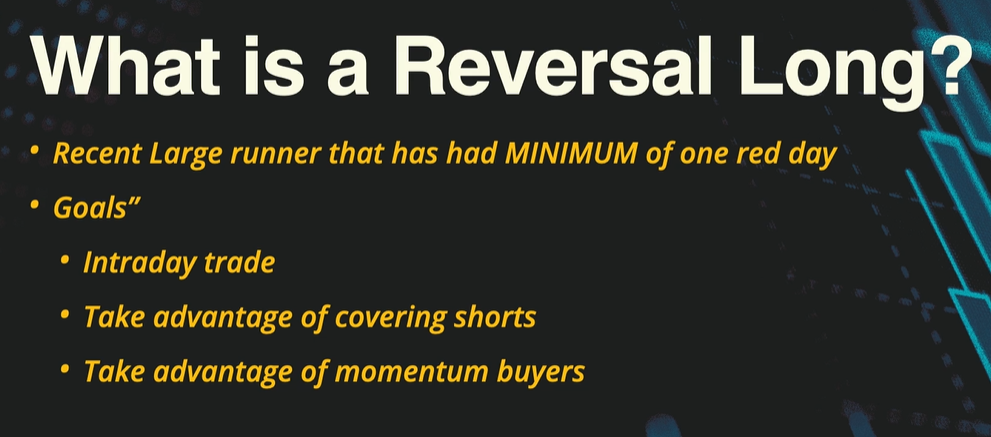
REVERSAL LONG PATTERN
__________________________________________________________________________________________________________________
A REVERSAL LONG PATTERN SETS UP ON A 5-DAY CHART, LIKE:
A LARGE GAP-UP GREEN DAY CANDLE, A GAP DOWN RED DAY CANDLE=================Stalk it for a [Reversal Long] on DAY 3.
A LARGE GAP-UP GREEN DAY CANDLE, A DOJI RED DAY CANDLE, A RED DAY CANDLE===== Stalk it for a [Reversal Long] on DAY 4.
A LARGE GAP-UP GREEN DAY CANDLE, TWO RED DAY CANDLES=======================Stalk it for a [Reversal Long] on DAY 4.
A LARGE GREEN DAY CANDLE, TWO RED DAY CANDLES, A DOJI RED DAY CANDLE======== Stalk it for a [Reversal Long] on DAY 5.
A LARGE GAP-UP GREEN DAY CANDLE, FOUR RED DAY CANDLES======================Stalk it for a [Reversal Long] on DAY 6.
A LARGE GAP-UP DAY, A RED DAY, A GREEN DAY CANDLE *THAT CLOSED BELOW THE PRIOR DAY'S CLOSE* (i.e. thus it is a RED DAY officially)====Stalk it for a [Reversal Long] on DAY 4.
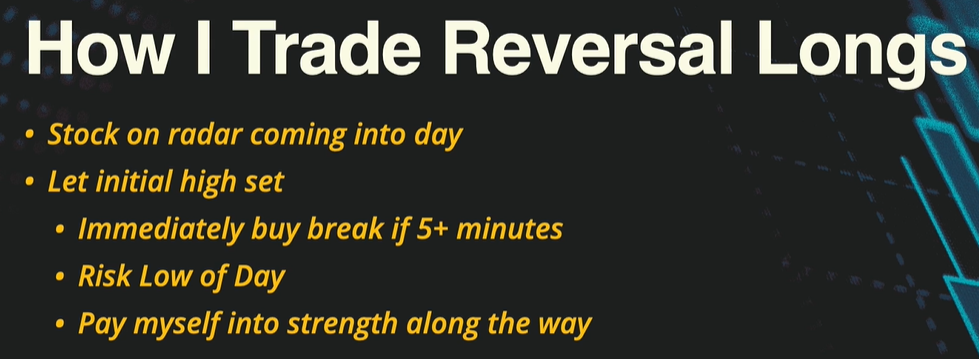
^ Watch the stock during the market open at 9:30am...And once the stock price goes ABOVE it's current HIGH on that morning, wait at least 5 mins, then ONLY BUY SHARES if the stock has a BREAKOUT over it's morning high... The stock will then go from red-to-green #worg (it will traverse above the yellow-dashed line in STT)... take profits into strength.
__________________________________________________________________________________________________________________
CRITERIA (for A+ setup of the pattern)
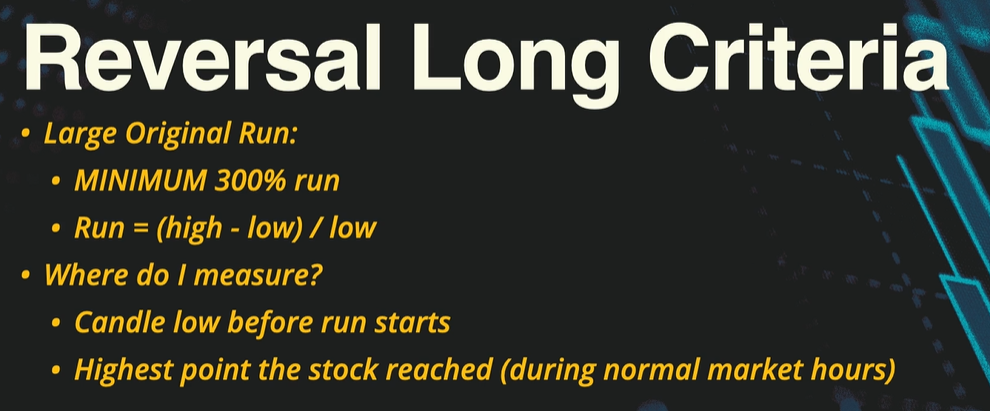
- Is up at least 300% over it's past couple of days.
- Has had AT LEAST ONE RED DAY [RED CANDLE ON THE DAILY CHART) DURING IT'S RUN-UP PHASE.
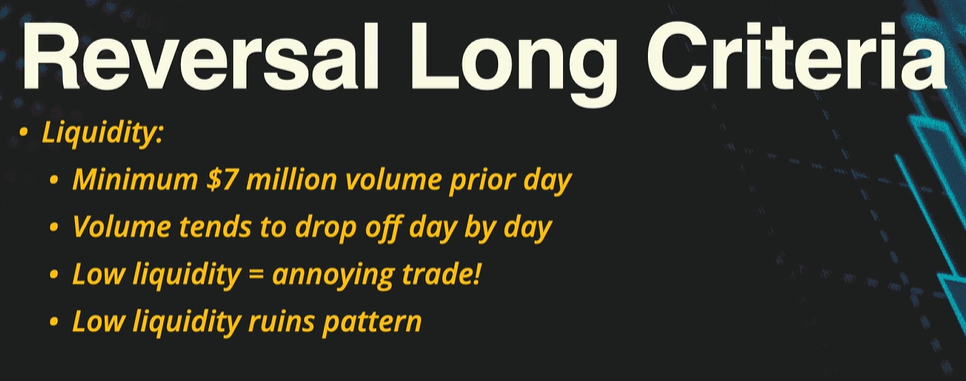
- High liquidity in dollar volume (low liquidity ruins fills & the pattern does not REVERSAL bounce (but rather just fades away)).
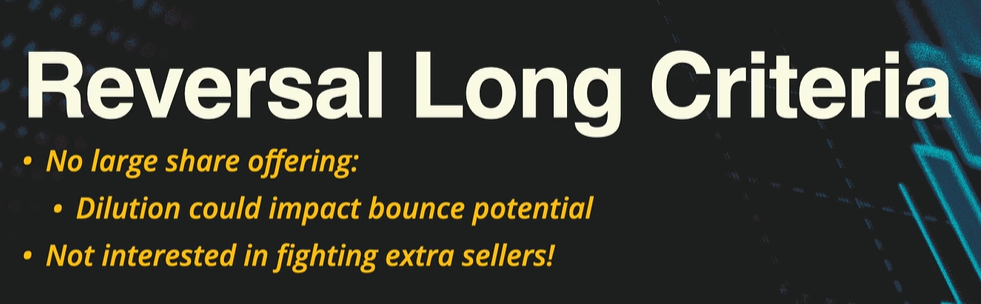
- No signs of an OFFERING having happened, nor happening; (no dilution!). More sellers slows the stock from REVERSE BOUNCING.
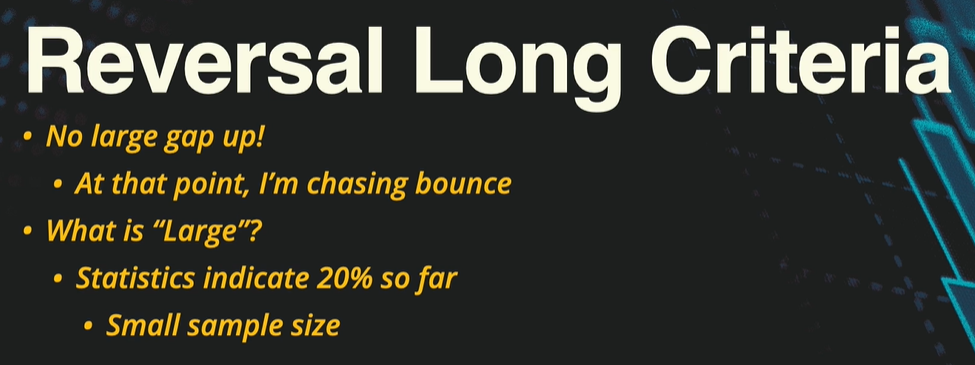
- No large gap up (on the day i am considering playing the stock)... a large gap up means it's already bouncing; don't chase the bounce!... If the stock has spiked up over 20%+ after a red day, it had a very high failure rate.
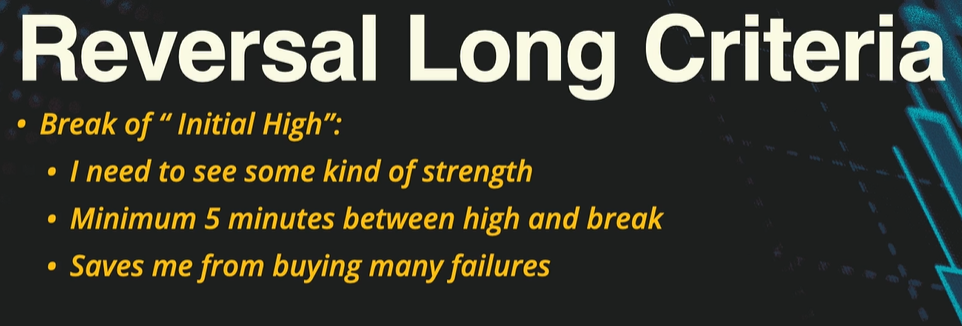
- the entry signal to buy the stock on it's REVERSAL DAY is: when the stock break's it's initial morning high. It breaks its INITIAL DAY HIGH for at least 5 minutes (it breakouts for at least 5 minutes between it's initial HIGH and it's new breakout point! (this helps guarantee that the stock doesn't just set it's high of day and then fade off).
_______________________________________________________
Keys (keys to heed when trading the pattern)
_______________________________________________________
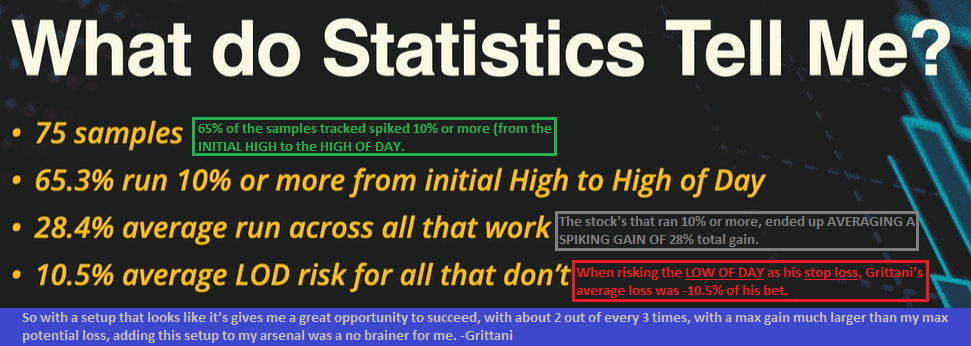
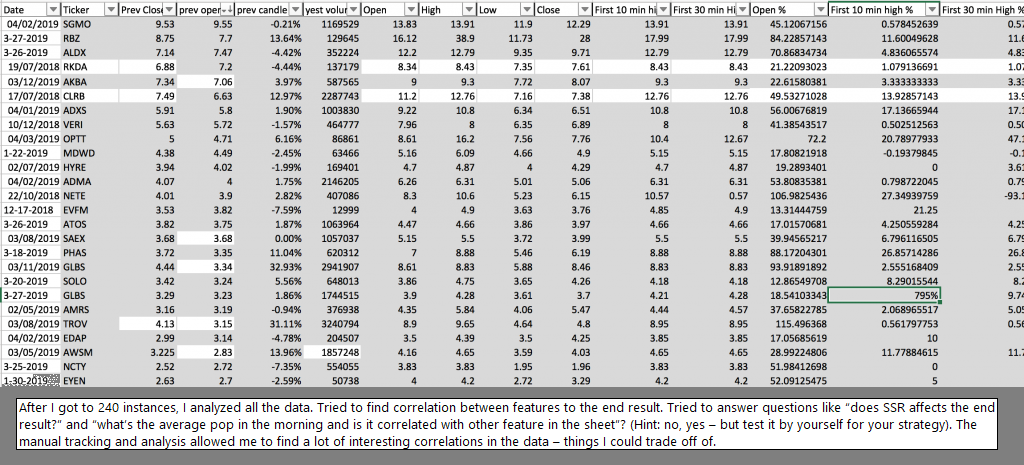
Only track the STOCKS that successfully played the pattern out! this way i can look for the multiple similarities the "successful" stocks had with one another, and find consistencies in the probabilities behind a pattern's success.... Then create RULES to follow (based on the factors that the stock ought to possess (i.e. low float, etc.).
FOR ALL PATTERNS, I MUST:
1. track the average gain (the average gain possible across 100+ samples) --- tells me when best to take profits (so i don't get greedy; gives confidence in holding my position optimally).
2. track the top tick % (what is the avg top tick ($) across 100+ samples) --- tells me when it is best to enter the trade.
3. track the bottom tick % (what is the avg bottom tick ($) across 100+ samples) --- tells me when it is best to exit the trade.
I CAN ADD [SPIKEET] TO MY EXCEL SPREADSHEETS BY USING THE "SPIKEET PLUGIN" TO RETRIEVE STOCK MARKET DATA FOR ME -------- www.twitter.com/_spikeet/status/1567826513915006976?s=20 ......... https://bit.ly/3xB4seL ......... #SPIKEET #EXCEL
As a beginner trader, narrow your entire trading to one or two patterns so you can just FOCUS on those patterns... Then improve your entry and exit points to make this pattern PERFECT based on your performance... Experienced traders know where they're going to enter and exit. Beginner traders do not have enough data to back up their thesis. This is the major difference between experienced and beginner traders... -Dux
____________________________________________________________________________
How to track GAPPERS / %GAIN DAY 1 statistics (onwards) ------------ categorize my statistics based on Grittani's Trading Tickers 1 (PART 1) DVD --------- Min 3:55:00 ..........................
Min 18 ------ Min 57 ------- CHAPTER 3 ------- Trading Tickers 2 ----- tracking BREAKOUTS --------- members.timothysykes.com/lessons/trading-tickers-2-chapter-3 .........
TRACKING STATS ------ Min 51:20----Min 1:12:45 ----- PART 4 ---- TRADING TECHNIQUES ....
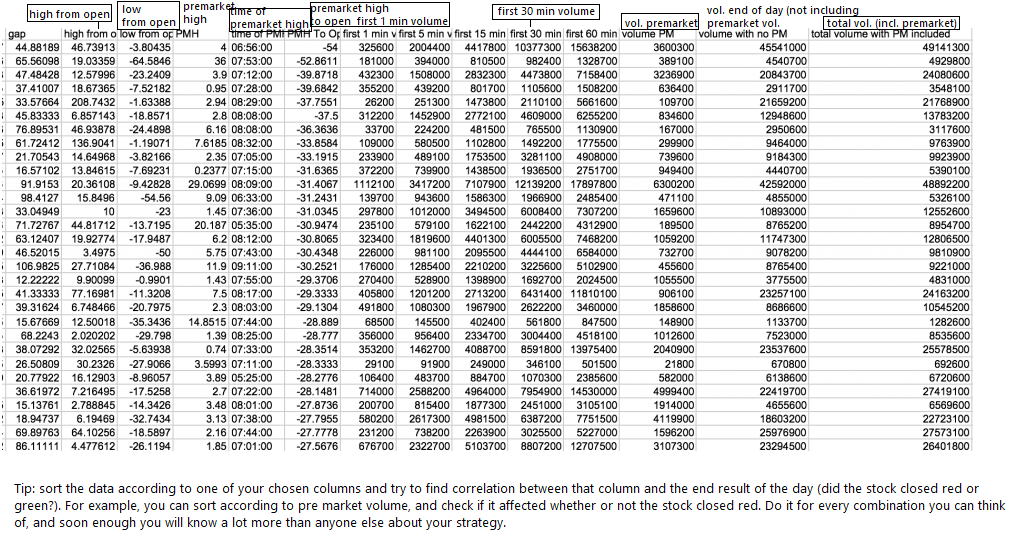
- When tracking VOLUME, always track both of these:::::: [VOLUME in premarket] and [VOLUME end of day].......
- What was the stock's OPEN price?
- What was the stock's CLOSE price?
- What was the stock's HIGH TICK price?
- What was the stock's LOW TICK price?
__________________________________________
REVIEW MY PART 4 STATISTICS NOTES I TOOK ON TRADING TECHNIQUES (DUX's DVD)! --- PART 4 (STATISTICS) -------- http://qintarcapital.com/trading-techniques.php ........
- consider tracking how the SPY is performing on the day.
- track stocks that've dropped 20% in a 10-minute time-frame.
SCANNER (for finding the pattern)
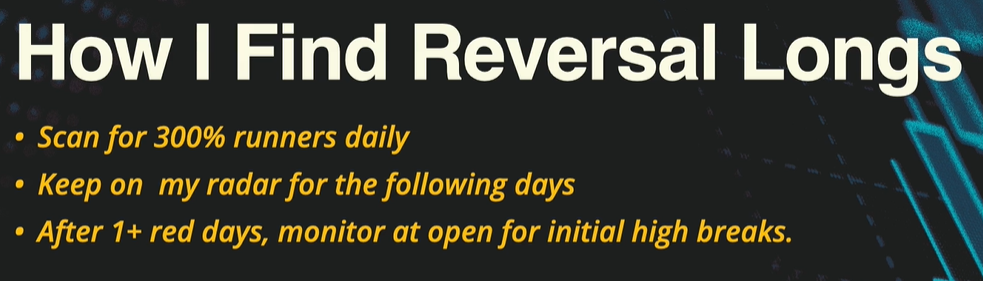
A] at the end of each day, SCAN for stocks that are on a 300%+ run starting back from 5-days ago (i.e. scan for stocks with a high of 300%+ within it's past 5-days... TO DO THIS: in the PAST 5 DAYS, determine what the stock's ultimate low was... is the stock up 300%+ from it's previous 5-day low??????
To determine how much of a "run' a stock is on: Run = (high during market hours - low of the previous 5 days) ÷ low of previous 5-days ... [Min 3 ----- Min 11:30 ------ Min 14 ------ TT2, Ch. 7.]
IF THE STOCK IS UP 300%+ FROM IT'S PREVIOUS 5-DAY LOW:
Check the daily chart to ensure I'm not tracking REVERSE SPLITS by accident.
Ensure there's a Dollar Volume of at least $7 million.
THEN KEEP THE STOCK ON MY WATCHLIST FOR THE UPCOMING DAYS,
AND MAKE SURE NO BIG OFFERINGS HAPPEN,
AND WAIT FOR THE FIRST RED CLOSE TO HAPPEN.
ONCE THE RED CLOSE HAPPENS, THE NEXT UPCOMING DAYS IT BECOMES A MATTER OF MONITORING AT OPEN FOR INITIAL HIGH BREAKS...
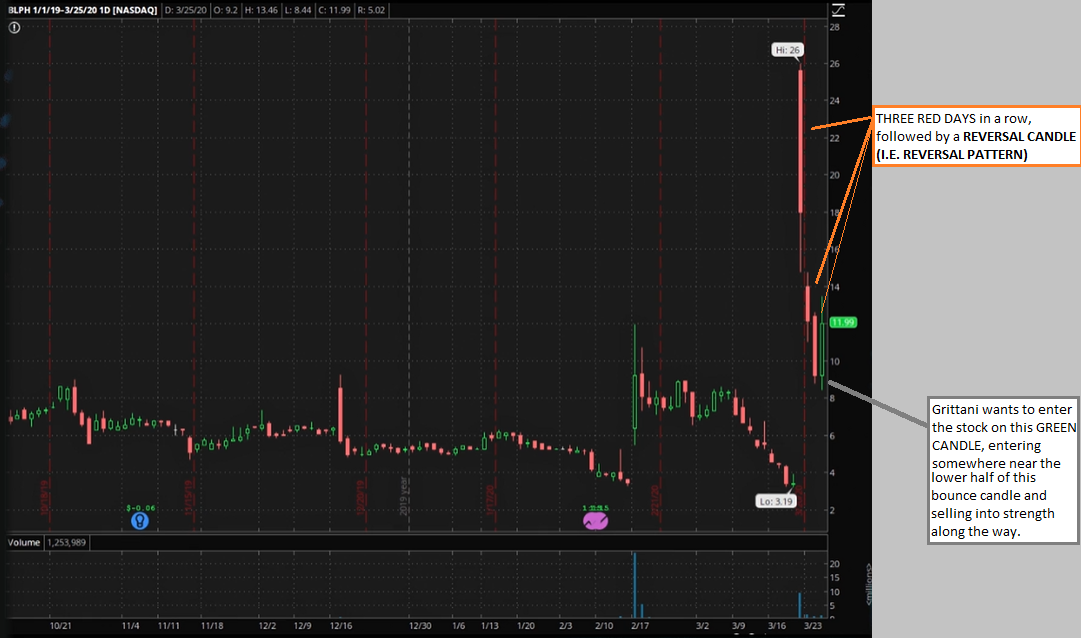
MONITOR THE STOCK AT THE OPEN FOR INITIAL HIGH BREAKS (If the stock is about to break it's initial MORNING HIGH, I AM GOING TO PULL THE TRIGGER (a BUY signal to enter the trade). -Grittani
B] VIEW the chart to see if there is AT LEAST ONE RED DAY CANDLE since it's spiking up 300+% (this red day is what allows there to be a REVERSAL PATTERN bounce play).
C] there should be at least $7million in dollar volume on PREVIOUS DAY. IGNORE THE PLAY If liquidity drops below $7m DOLLAR VOLUME during the stock's RED DAYS, then i know the next day it holds no interest for me; the liquidity is not there.
D] no dilution occurring! (no signs of an offering recently!). IGNORE THE PLAY IF THERE IS AN OFFERING #DILUTION.
E] IGNORE THE PLAY IF THE STOCK HAS GAPPED UP ALREADY (SPIKING 20%+ AFTER ITS FIRST RED DAY). (if it has spiked 20% after a red day, this makes the REVERSAL PATTERN fail since the bounce itself has already happened). This includes any 20%+ spike that is a GAP UP (usually based on NEWS).
F] IGNORE THE PLAY If the stock has a GREEN CLOSE after one or more RED DAYS. It's that first green candle that I'm lookin to capitalize on (once there's a red day & THEN A GREEN DAY, then the pattern is over).
G] the stock breaks out for at least 5-min between it's initial HIGH, and it's new breakout point, then as soon as it builds back to break that high, on that breakout is where i want to LONG the stock (risking LOW OF DAY)! (this helps escape fake reversals). [Min 14 ---- TT2, Ch. 7.]
I ALREADY WATCHED EVERYTHING BELOW!
Min 31 ------- track metrics and statistics (i.e. how to track Reversals) --------- scan the performance of all stocks that have dropped 20% in a 10-minute time frame; then track if i should sell at 10% profit, 20% profit, after an hour, at the end of the day?------ www.youtube.com/watch?v=7ITsJr1hjl8 ............ #KrisVerma
REVIEW MY PART 4 STATISTICS NOTES I TOOK ON TRADING TECHNIQUES (DUX's DVD)! --- PART 4 (STATISTICS) -------- http://qintarcapital.com/trading-techniques.php ........
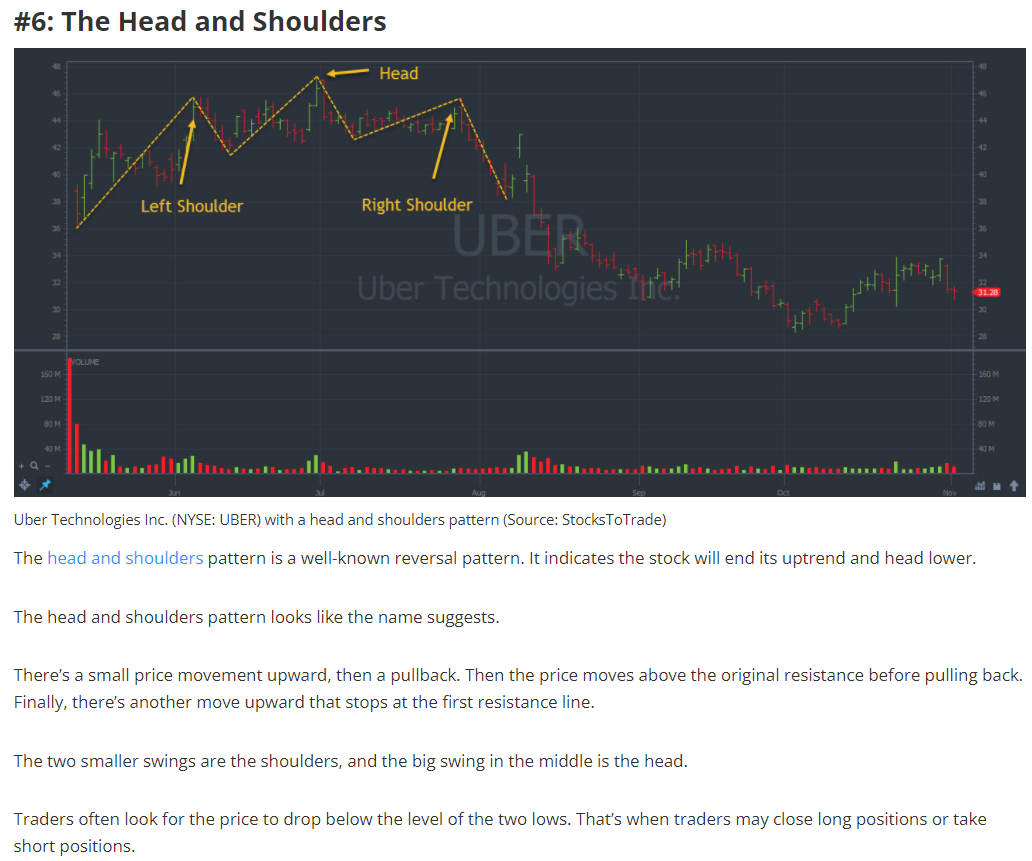
Reversal traders: Reversal trading is entering a
position during a trend change on a chart. Buying a reversal consists of
waiting for a clear change in a current price direction where it appears to be
now going in the opposite position from the previous high or low (buying a
dip in a down trend that appears to have put in a low for price and selling
short after a chart rips higher in price but seems to have put in a high price
is trading a reversal).
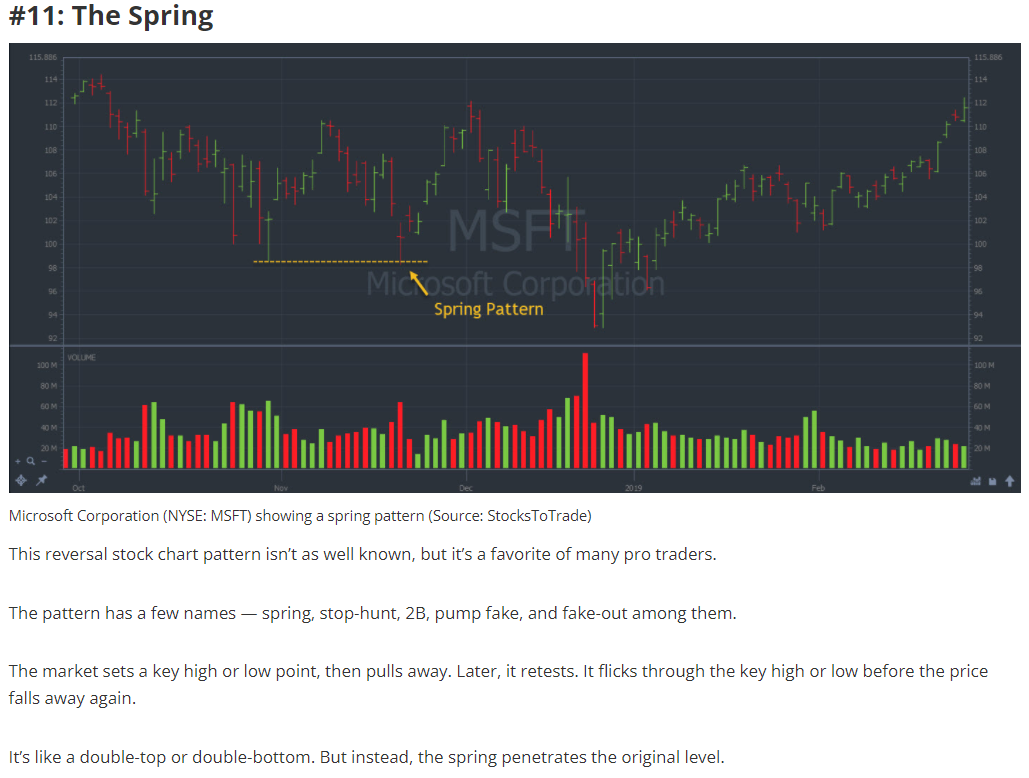
Take it from me … If a
stock is in a clear downtrend, wait for clear confirmation of a reversal to the
upside before attempting to hero-buy calls. #dipbuys #options
I
stick to earnings winners. i stick to contract winners. i stick to
shorting pump and dumps. Sometimes I do technical breakouts and
reversals. - Sykes
The REVERSAL PATTERN can also take place with large cap stocks... I don't only look at micro caps... -Grittani
When $SPY goes green for
a couple of days in a bear market (when indices bounce a bit, even in a bear
market), that can cause other stocks to spike for a short period. And that's
where day traders can profit. (keeping in mind that no trend(upwards or
downwards) happens without pull-backs and slight reversals; i.e. no stock just
goes straight up or goes straight down ever, instead it "trends" with
pull-backs of all sorts). -Roland Wolf #environment #$SPY
Fun fact: Looking at
previous bear markets, the single-largest reversal day has never before marked
the bottom. The indexes have always traded lower following the huge reversal
day. Keep this in mind when assessing whether you think the market’s headed
lower. -Mark Croock
CHARACTERISTICS OF A
MARKET REVERSAL FROM BEAR MARKET TO BULL MARKET
It’s not as easy in
practice as it is in theory to deal with an unknowable future and wild moves up
and down in price action over time.
Disbelief: After a bear
market the first rallies into a new bull market are not believed to be real.
Most people think the rally will fail.
Hope: The first step in
beginning a new bull market is that a price recovery from the lows is possible
and the move higher holds.
Optimism: The bull
market can start trending higher on the optimism that the new upswing in price
is real.
Belief: Buyers will
begin to act on the faith in the trend higher and begin entering back into the
chart.
Thrill: When the thrill
of profits and making money begins the sentiment turns bullish and people
become vocal about buying.
Euphoria: The peak in
prices in bull markets are reached on euphoria as holders start thinking they
are geniuses for being long for so long and they start projecting how much
money they will make going forward based on previous returns.
Complacency: People
don’t believe the recent high prices at the top was the end of the bull run and
that the big drop is just going to be a small pullback before making new all
time highs in price.
Anxiety: Holders start
becoming concerned and worried as the pullback evolves into a long downtrend in
price.
Denial: Holders decide
to just stay in the market thinking their cryptos are good long-term
investments.
Anger: Mad that the
expected profits did not happen and money was lost instead.
Panic: Holders panic and
think it may be best to just get out of the market and just save the capital
they have left.
Depression: Holders are
depressed about giving back their bull market profits and feel foolish for not
exiting at the right time.
Disbelief: After
experiencing a bear market the first rallies into a new bull market are not
believed to be real. People think the rally will fail and the market will
return to the lows.
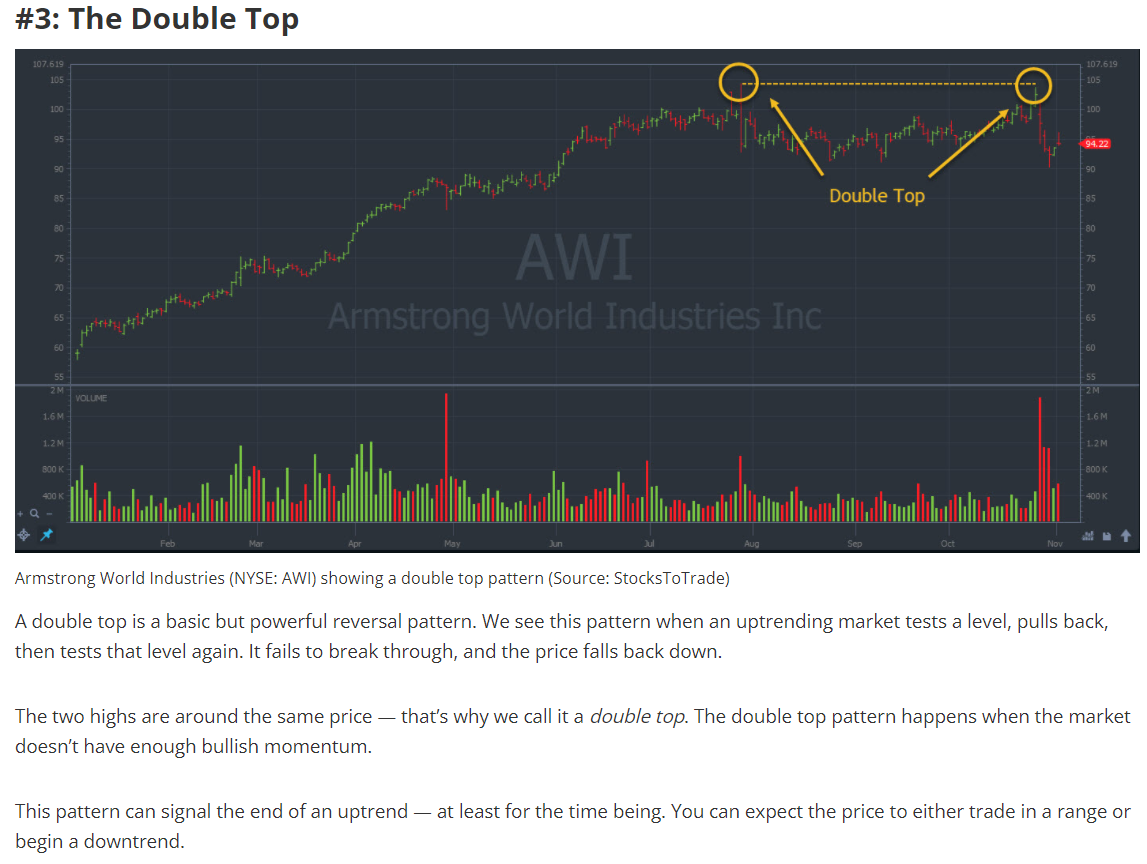
If the market is up-trending and breaks through the pivot point, the
first resistance level is often a good target to close a position, as the
probability of resistance and reversal increases greatly.
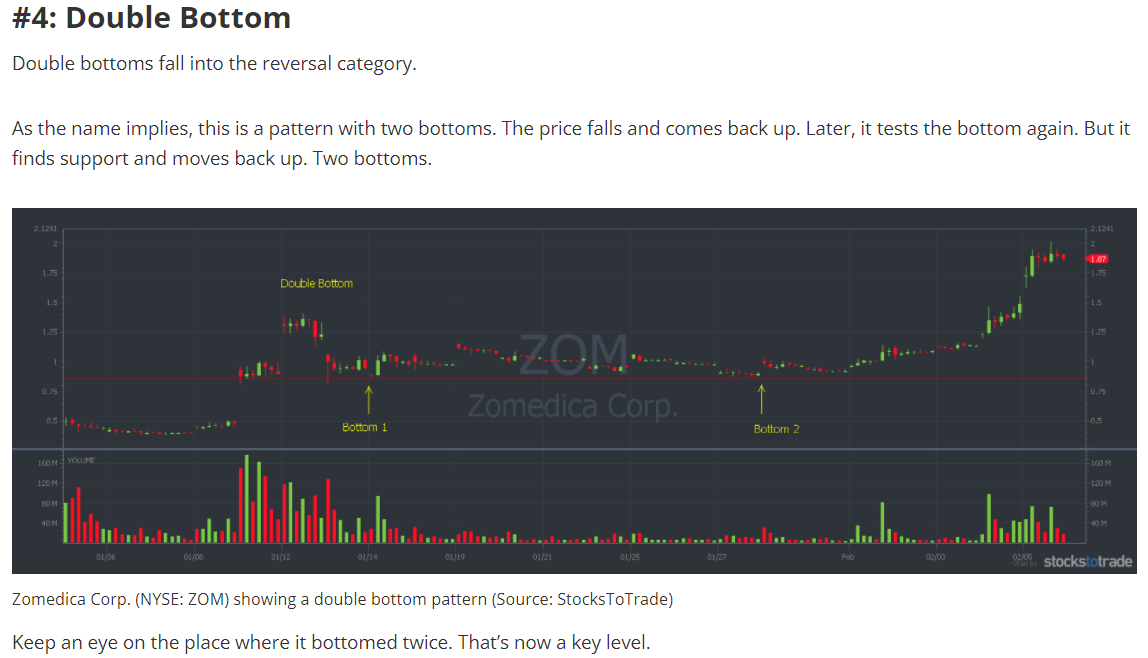
Secrets to timing huge reversals:::::: we all know what happens to stocks that fly so high, so quickly… A reversal ... as much as 10% in a brutal first red day....... -Mark Croock
reversal patterns (vs. continuation patterns) --------- https://stockstotrade.com/continuation-patterns ........
Min 22:55 --------- HOW TO MANAGE MY TRADE (I.E. RAISE MY STOP LOSS HIGHER IF THE TAPE IS HOLDING A LEVEL HIGHER THAN WHAT I WAS CURRENTLY RISKING; RAISING MY STOP LOSS MEANS I CAN BUY ADDITIONAL SHARES, THUS LOWERING MY AVERAGE ENTRY PRICE, WHILE MAINTAINING GOOD RISK MANAGEMENT!) --------- manage my trades by raising my RISK LEVEL potentially (raising my STOP LOSS), which would then enable me to add more shares to my current open position, based on the SHARES I TOOK with my risk initially being lower, serving as a fraction of the TOTAL POSITION SIZE I AM ABLE TO ACTUALLY TAKE were i to raise my risk/stop loss level! ------- Trading Tickers 2 – Chapter 7 -------- https://members.timothysykes.com/lessons/trading-tickers-2-chapter-7 ......... #RiskMgmt #sizing #scaling