
BREAK | BREAK OUTS | SPIKES | #BREAKOUTS | #BREAK-OUTS | BREAK-OUTS
Min 00:00:01 (1.5 hrs) --------- AFTERNOON BREAKOUT [pattern] ---------- Min 2:20 - Min 13 (afternoon breakout criteria) -------- Min 13 (how to play the Breakout) ----- Trading Tickers 2 – Chapter 8.....
Min 4 ------- take notes on this and update my SPREADSHEETS (yahooFinance and finviz are almost always outdated; look either in SEC filings, or use BLOOMBERG.COM (one site that does a very good job updating SHARE COUNTS when there are offerings, etc.)! -Grittani ----- Trading Tickers 2 – Chapter 8............
Min 27 ------------ look at the biggest % gainers in the past 5 DAYS! ---- "Spikeability" DVD --------- Part 2 ------------ https://members.timothysykes.
https://www.youtube.com/watch?
https://www.youtube.com/watch?
https://www.youtube.com/watch?
https://www.youtube.com/watch?
Min 6:24:00 (2 hours) ------ LONGING major daily BREAKOUTS (Nasdaq/listed) ------- TRADING TICKERS 1 --- Part 2 -------- https://members.timothysykes.com/lessons/trading-tickers-1-part-2 ........
Min 00:00:01 (1.5 hrs) --------- AFTERNOON BREAKOUT [pattern] ---------- Min 2:20 - Min 13 (afternoon breakout criteria) -------- Min 13 (how to play the Breakout) ----- Trading Tickers 2 – Chapter 8.....
Min 6 (3 mins) — LONGING breakouts (Nasdaq/listed) ---------------- Trading Tickers 2 -- Chapter 4........
Min 2:40 (2 mins) — LONGING OTC multiday Breakouts ----------- Trading Tickers 2 -- Chapter 4.......
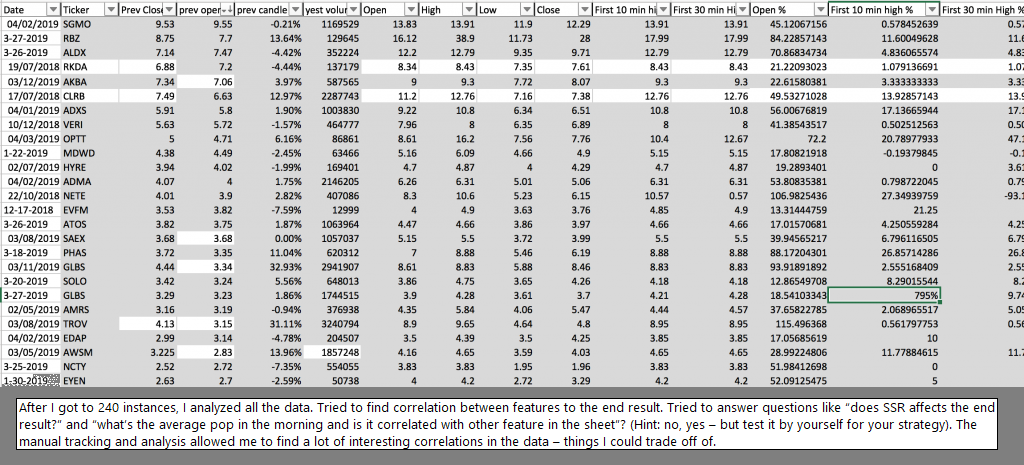
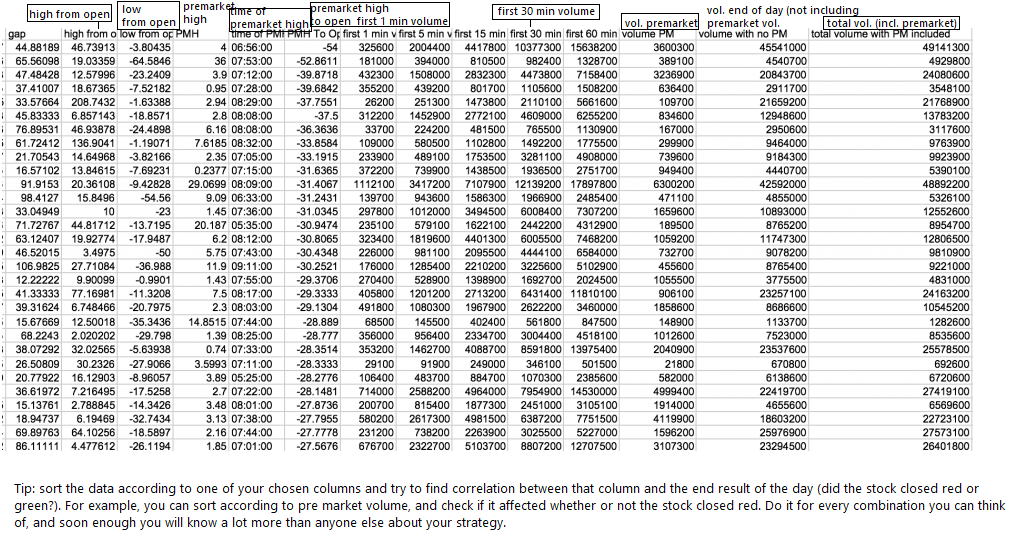
AFTERNOON BREAKOUT DATA TRACKING --------- Min 1:15:30 — MIN 1:45:00 — how to optimize AFTERNOON BREAKOUT spreadsheet for evaluation— TT2 — Chapter 3..........
Min 1:01:45 — TT2 ---- Chapter 3 —— TRACKING AFTERNOON BREAKOUTS SPECIFICALLY! — and how to CALCULATE ALL SORTS OF DYNAMICS!!!!!!!!!!! Grittani gives formulas and ways of doing everything! ——Take notes on calculating the percent gain potential I have in a afternoon breakout setup! SETUP MY AFTERNOON BREAKOUTS SPREADSHEET JUST AS GRITTANI HAS HIS SETUP HERE....
Min 1:01:00 --------- how to create FORMULAS to generate further evaluations/analysis of data that was tracked --------- CHAPTER 3 -------- TRADING TICKERS 2 --------- https://members.timothysykes.com/lessons/trading-tickers-2-chapter-3/ ............
snip Min 18:50 (afternoon breakout)-------- TAKE NOTES! Into my statistics
  Google sheets !--------- TT2 (trading tickers 2) ------- Chapter 3...............
Min 18:50 (afternoon breakout)-------- TAKE NOTES! Into my statistics Google sheets !--------- TT2 (trading tickers 2) ------- Chapter 3...............Min 18 ------ Roland Wolf on buying breakouts and risk management when playing breakouts ---- Trading Tickers really helped him understand a better method for risk mgmt when buying breakouts ----- www.youtube.com/watch?v=cjc2yzqh9yw ........!!!!!!!
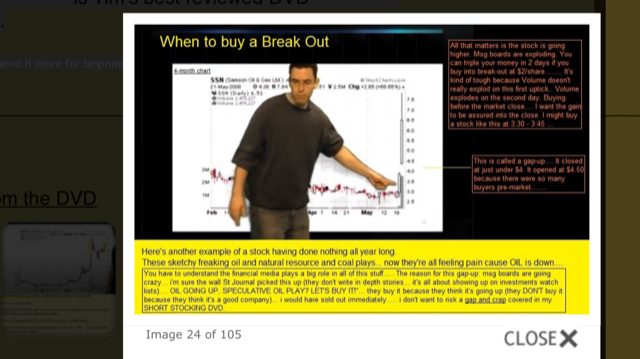
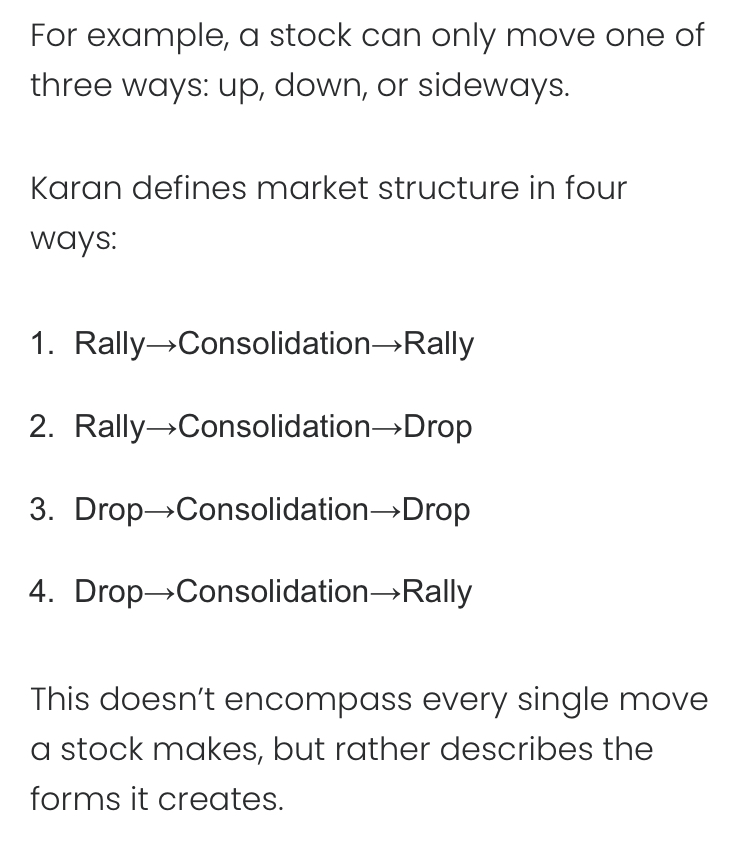
Whether it's earnings or technical breakouts....... stocks can have legs.... 2-4 days worth....... -Sykes
With low-priced stocks -- do not be looking to dip-buy... look to buy breakouts...... -Sykes
The main reason why people lose money is because of greed and poor risk management... -[trader who makes $250k a yr trading]
Min 19:55 ---- there are million types of breakouts ------ hold a bit longer ---- scale out slowly -------- there's a way to win in trading, you just need to find it for yourself ----- www.youtube.com/watch?v=klGtzh0vsRI ......... #Tuohey
THE KEY TO CATCH THE STOCK BREAKING OUT RIGHT BEFORE IT DOES -------- www.youtube.com/watch?v=7drv99rvVnA............Min 6 especially......... KEEP EYE OUT ON ----- high volume. read stock history before tech breakout to see which have legs (in the stock's historical chart). GREAT if there is good news. if it is a hot sector. big volume. earnings winners. a new billionaire investor.
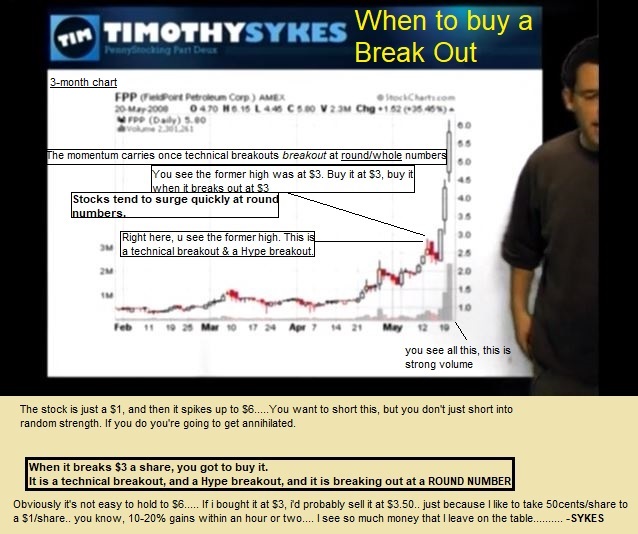
Breakout traders --- Perhaps the most predictable traders in the market. These traders buy penny stocks when it's near premarket high, intraday high, and previous day high. Breakout trading pattern is the most commonly taught strategy in many day trading chat rooms. Thus the crowded buying could cause penny stock breakouts to fail.
TIM SYKES ON SOMETIMES CHASING STOCKS AT MARKET OPEN
Some of these plays that really run, right near the open, it really pays off to be a little speculative early on. . if you wait, you might just miss the big run-up (at market open). . . When you have these fast runners, sometimes you don't get a dip, so i risk it a little bit when i think that it deserves that risk. . i don't chase everything (usually i should wait for a dip), but the big percent gain was there. . . -sykes
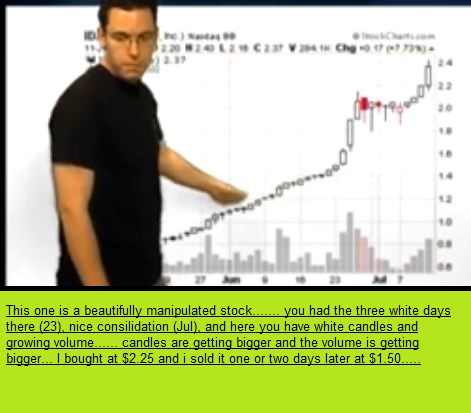
Min 26 – Min 30:40 ------ Jackaroo likes trading stuff that has massive price action and is a huge scam because the price action just makes more sense to him | buying breakouts on a strong market (stock spikes, pulls back, then buying it on the breakout #scams price action is most clean for breakouts) | shorting stocks that are way too over-extended (if it is up 3-5 days in a row then I look to short it when it’s falling off the cliff) | panic dip buying is a little bit tricky but if it’s a natural type selling pressure due to stop losses and not massive dilution then usually there’s a good bounce --- I just traded these patterns the last 5 years and really grew my account … THE MORE VOLUME THERE IS THE GREATER THE OPPORTUNITY (THE LESS RISK THERE IS) BECAUSE THEN THERE IS NO WORRY ABOUT SLIPPAGE; VOLUME IS JACKAROO’S #1 INDICATOR, THEN TECHNICAL LEVELS (HISTORY OF THE STOCK’S CLEAN PERFORMANCE OR IS IT SUPER CHOPPY?) --- DAY CANDLES THAT AREN’T VERY WICKY BUT HAVE SOLID CANDLE BODIES ------- www.youtube.com/watch?app=desktop&v=cj4X2fgAuHk …….
Min 21 --------- how to buy these breakouts ---------- www.youtube.com/watch?v=3NK6dzW_mBo ..........
HOW TO SETUP MY BREAKOUTS SPREADSHEET!!!!!!!!!!!
Min 1:01:00 --------- how to create FORMULAS to generate further evaluations/analysis of data that was tracked for BREAKOUTS specifically --------- CHAPTER 3 -------- TRADING TICKERS 2 --------- https://members.timothysykes.com/lessons/trading-tickers-2-chapter-3 ............
Min 1:12:00 --------- how to calculate what RISK % i should set for my STOP LOSS when trading *volatile* BREAKOUTS --------- CHAPTER 3 -------- TRADING TICKERS 2 --------- https://members.timothysykes.com/lessons/trading-tickers-2-chapter-3 ............
Categorize my statistics based on Trading Tickers 1 (PART 1) DVD in it's last 4 minutes! how he does it there is exactly how i gotta track stats and summarize them then into categories into a separate stat sheet!
read---------www.timothysykes.com/
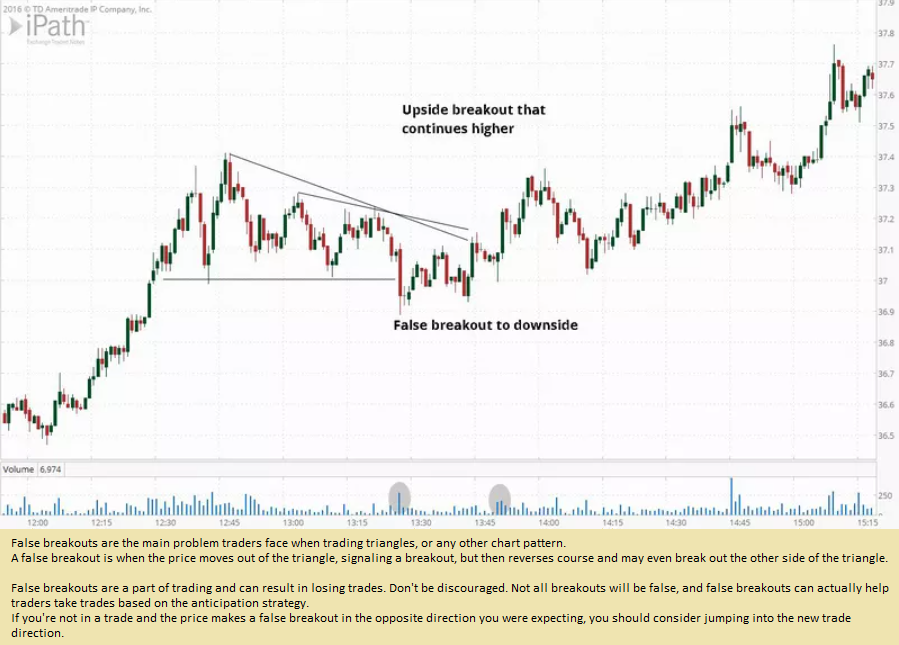
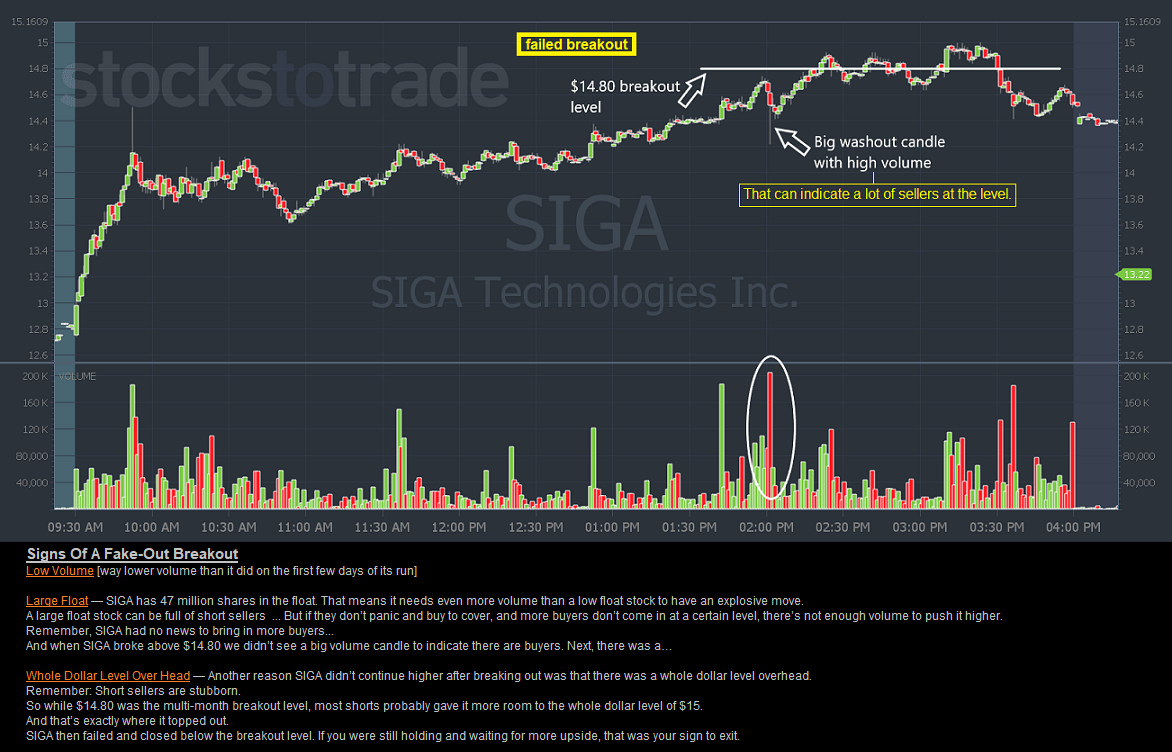
There are lots more false breakouts, perhaps because there are more computer-based trend followers.
Here’s the deal:
Not all breakouts will work out.
In fact, half or more of your breakout trades are likely to fail.
However, it doesn’t mean trading breakouts is a losing strategy, far from it.
Remember, it’s not how often you win that’s important.
It’s how much you win when you’re right and how much you lose when you’re wrong — that’s what matters.
Also… If you want to increase your odds of capturing a trend, you must trade across different markets. This includes Forex, Indices, Energy, Metals, Agriculture, etc. - RICHARD DENNIS
If you start chasing stocks, you will get bitten. . . . sacrifice the battle (miss a trade) to win the war.... Most people are not meticulous enough..... -[Sykes]
DIFFERENT BREAKOUTS ----- Min 20 ----- a list of all of the different types of breakouts ----------- Experiment with the different types of breakouts ------ www.youtube.com/watch?v=Maf5Lhy53UU .......
Higher and higher lows LEADS to a stock's spiking (likelihood)..... meaning the lows, when higher in price (support level) than it's previous lows, the stock will likely spike at a certain point..... -Sykes
With any trade that breaks a premarket high, we always risk a fakeout.
More often than not, shares will poke through the high and then quickly fall away.
That’s why the timing component is so crucial here.
It’s what made the difference.
Every time a stock runs up into a resistance level, give it 5-15 minutes to tell you which way it wants to go.
If shares spikXe through and quickly fall away, you know the morning trade is a no-go.
If shares hold near that level for 15 minutes and VWAP starts to creep up, now you’ve got a shot at pushing higher.
It’s also important to analyze the volume.
Higher volume means more conviction. When a stock makes a high-volume tail candle at the premarket highs, it will have a heck of a time trying to break through again.
Also, keep an eye on VWAP.
_________________________________________________________________________________________________________________________
SHORT SQUEEZES
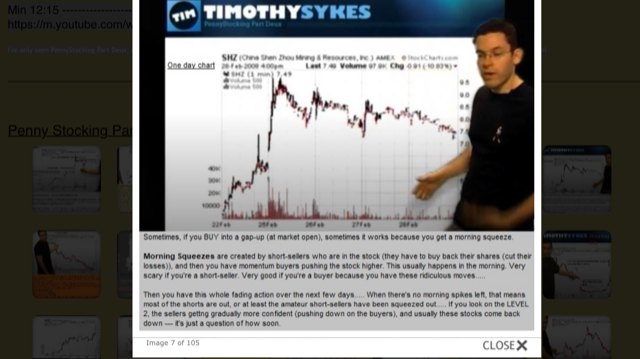
THE RECIPE FOR A SHORT-SQUEEZE: no one is selling shares (shown on level 2) ... thus, you have short's getting squeezed ... you have buy-ins ... you have lack of a volume ... and you have uptrending price action..... -Tim sykes
Every single short is a potential short-squeeze. When the short-squeeze happens, it's a potential buy..... -Sykes
Min 2 ----- the jest of a short-squeeze (being self fulfilling prophecy) --------- www.youtube.com/watch?v=DO4fMijqb-c ........... #JordanBelfort
Min 5:20 ------- on how a short-squeeze works --- Graham Stephan -------- www.youtube.com/watch?v=8YrnTbzuOWM ..........
___________________________________________________________________________________________________________
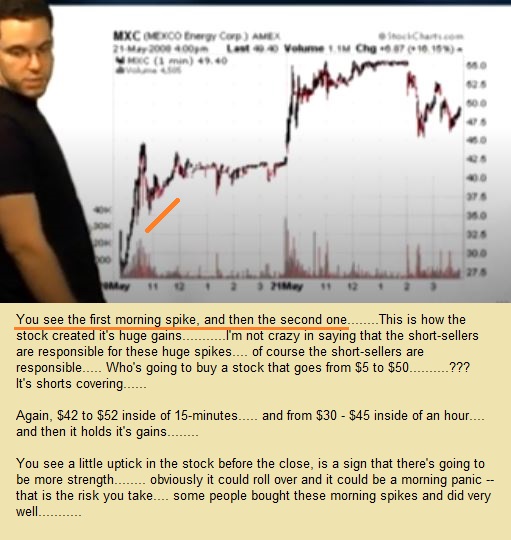
Short sellers love to lurk near the top of each stock. Shorting penny stocks are a very commonly taught trading strategy. But the immature shorts could sometimes be victims of a penny stock short squeeze. To get out of their position, short sellers have to buy to cover. That's why during penny stock intraday break outs the squeeze can go parabolic because the shorts are trapped [buying (to cover), thus increasing the stock's price and spike].
SHORT SQUEEZES --- BIO stocks make for the best squeezes, when short-sellers hold on to that little glimmer of hope. . . -Matt Monaco
Min 1:24 ---- Importance of volume breakouts ---------- www.youtube.com/watch?v=rq4jthS3nTA..............
Min 14 ------------ on TRADING TICKERS still having relevant patterns (ones that don't work so much: new promo releases (chapter 5) | listed(Nasdaq) stock breakouts are still kind of hit or miss.......GRITTANI tips ----- https://youtu.be/Vz0aoeT5bmA ..........
Min 20:40 --------- OTCs come and go (the multi-breakouts), they're not always hot. It's good to expand to the Listed stocks (NASDAQ) if you want to trade full-time....Roland Wolf ----- tips and affirmations --- www.youtube.com/watch?v=dAanETbgqNM ..........
Min 16 ------ Grittani strategies he still uses the most now are::::::::: buying OTC breakouts | over-extended gapdowns....... <------- Grittani's favorite 2 patterns to play...... https://youtu.be/Vz0aoeT5bmA ..
QUESTION: When would you buy when you see a #1 for the framework show up?
KYLE WILLIAMS: I don't like buying till #2-#3 during a breakout.
QUESTION: why?
KYLE WILLIAMS: its just early, very hard telling a supernova will take place being that early.
MAXEDOUTTRADES: that's a guessing game trying to find the next runner before it actually runs, its much easier to short overextended runners and current runners that have consolidated and break out
CATCHING THE Pattern #1 and Pattern #2 OF THE FRAMEWORK
Min 10 - end ------- look at consolidation on low volume, with lots of LEVEL 2 asks (relative to a smaller volume level) ----- and if it breaks, it has potential to spike up ----- www.youtube.com/watch?v=O9QRWjtxvnY .......
DIFFERENT TYPES OF BREAKOUTS
Min 19:30 ---------- there are a million types of breakouts, so for me finding the one that works best for me, that's when I started seeing success ------ www.youtube.com/watch?v=klGtzh0vsRI .........
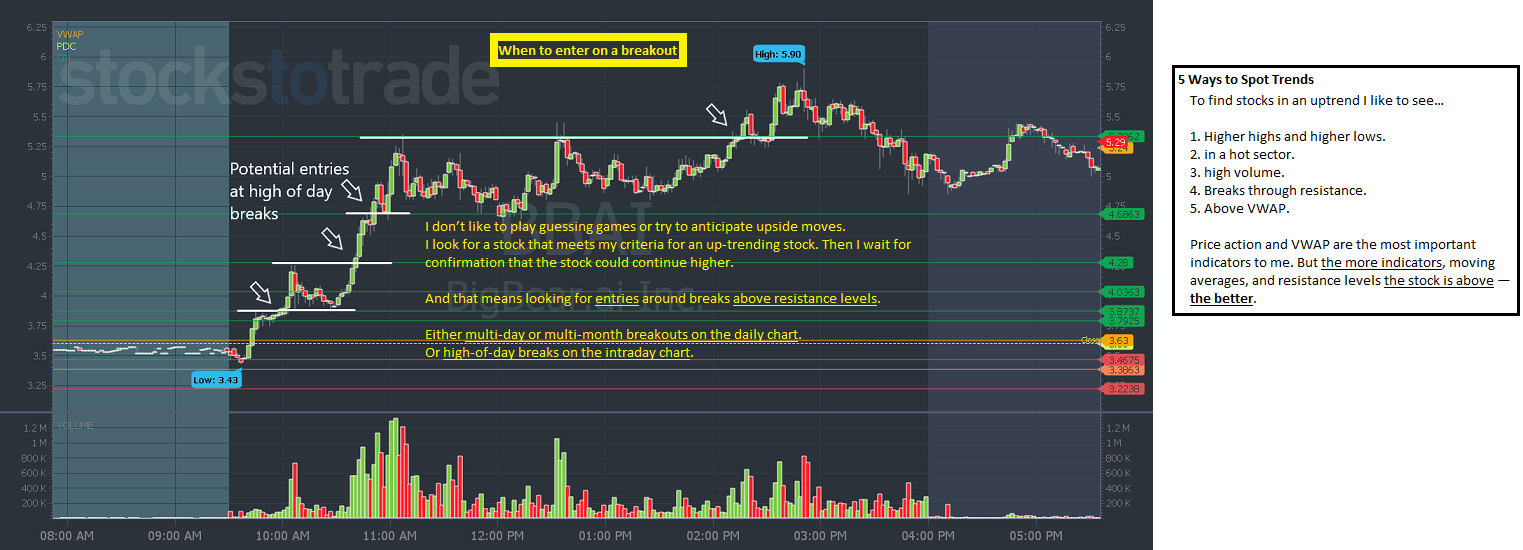
Min 24:30 --------- if i'm going for a breakout play, i don't want to enter at the breakout level...... ideally I'm selling into the high of day breakout area.... Find those VWAP areas ------ www.youtube.com/watch?v=klGtzh0vsRI .........
THE FRONT SIDE OF THE STOCK'S MOVE USUALLY HAPPENS CONTINUALLY WITHIN 5 DAYS........ UNLESS A NEW CATALYST COMES INTO PLAY AFTER DAY 5.......... OTHERWISE, BY DAY 6, DAY 7, DAY 8, THE STOCK IS ON IT'S BACKSIDE AND IS A SHORT........... -Bohen commentary
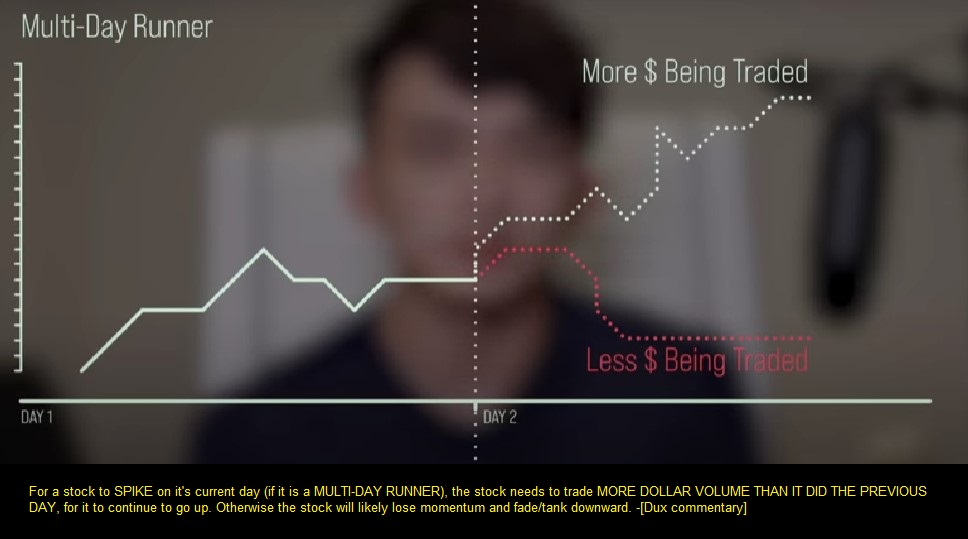
A STOCK IS A MULTI-DAY RUNNER, when a stock hangs around. It might be down a lot from yesterday’s premarket highs… But it’s still up roughly 150% over the last two days. [IN OTHER WORDS, a stock is considered a multi-day runner when it hangs around... Meaning, if it is still up a substantial %gain from when it first started it's run, then it is considered a multi-day runner, even if it looks like it's tanked / dipped from it's highs (i.e. and it's still up in % overall from when it first spiked)].
SPIKING
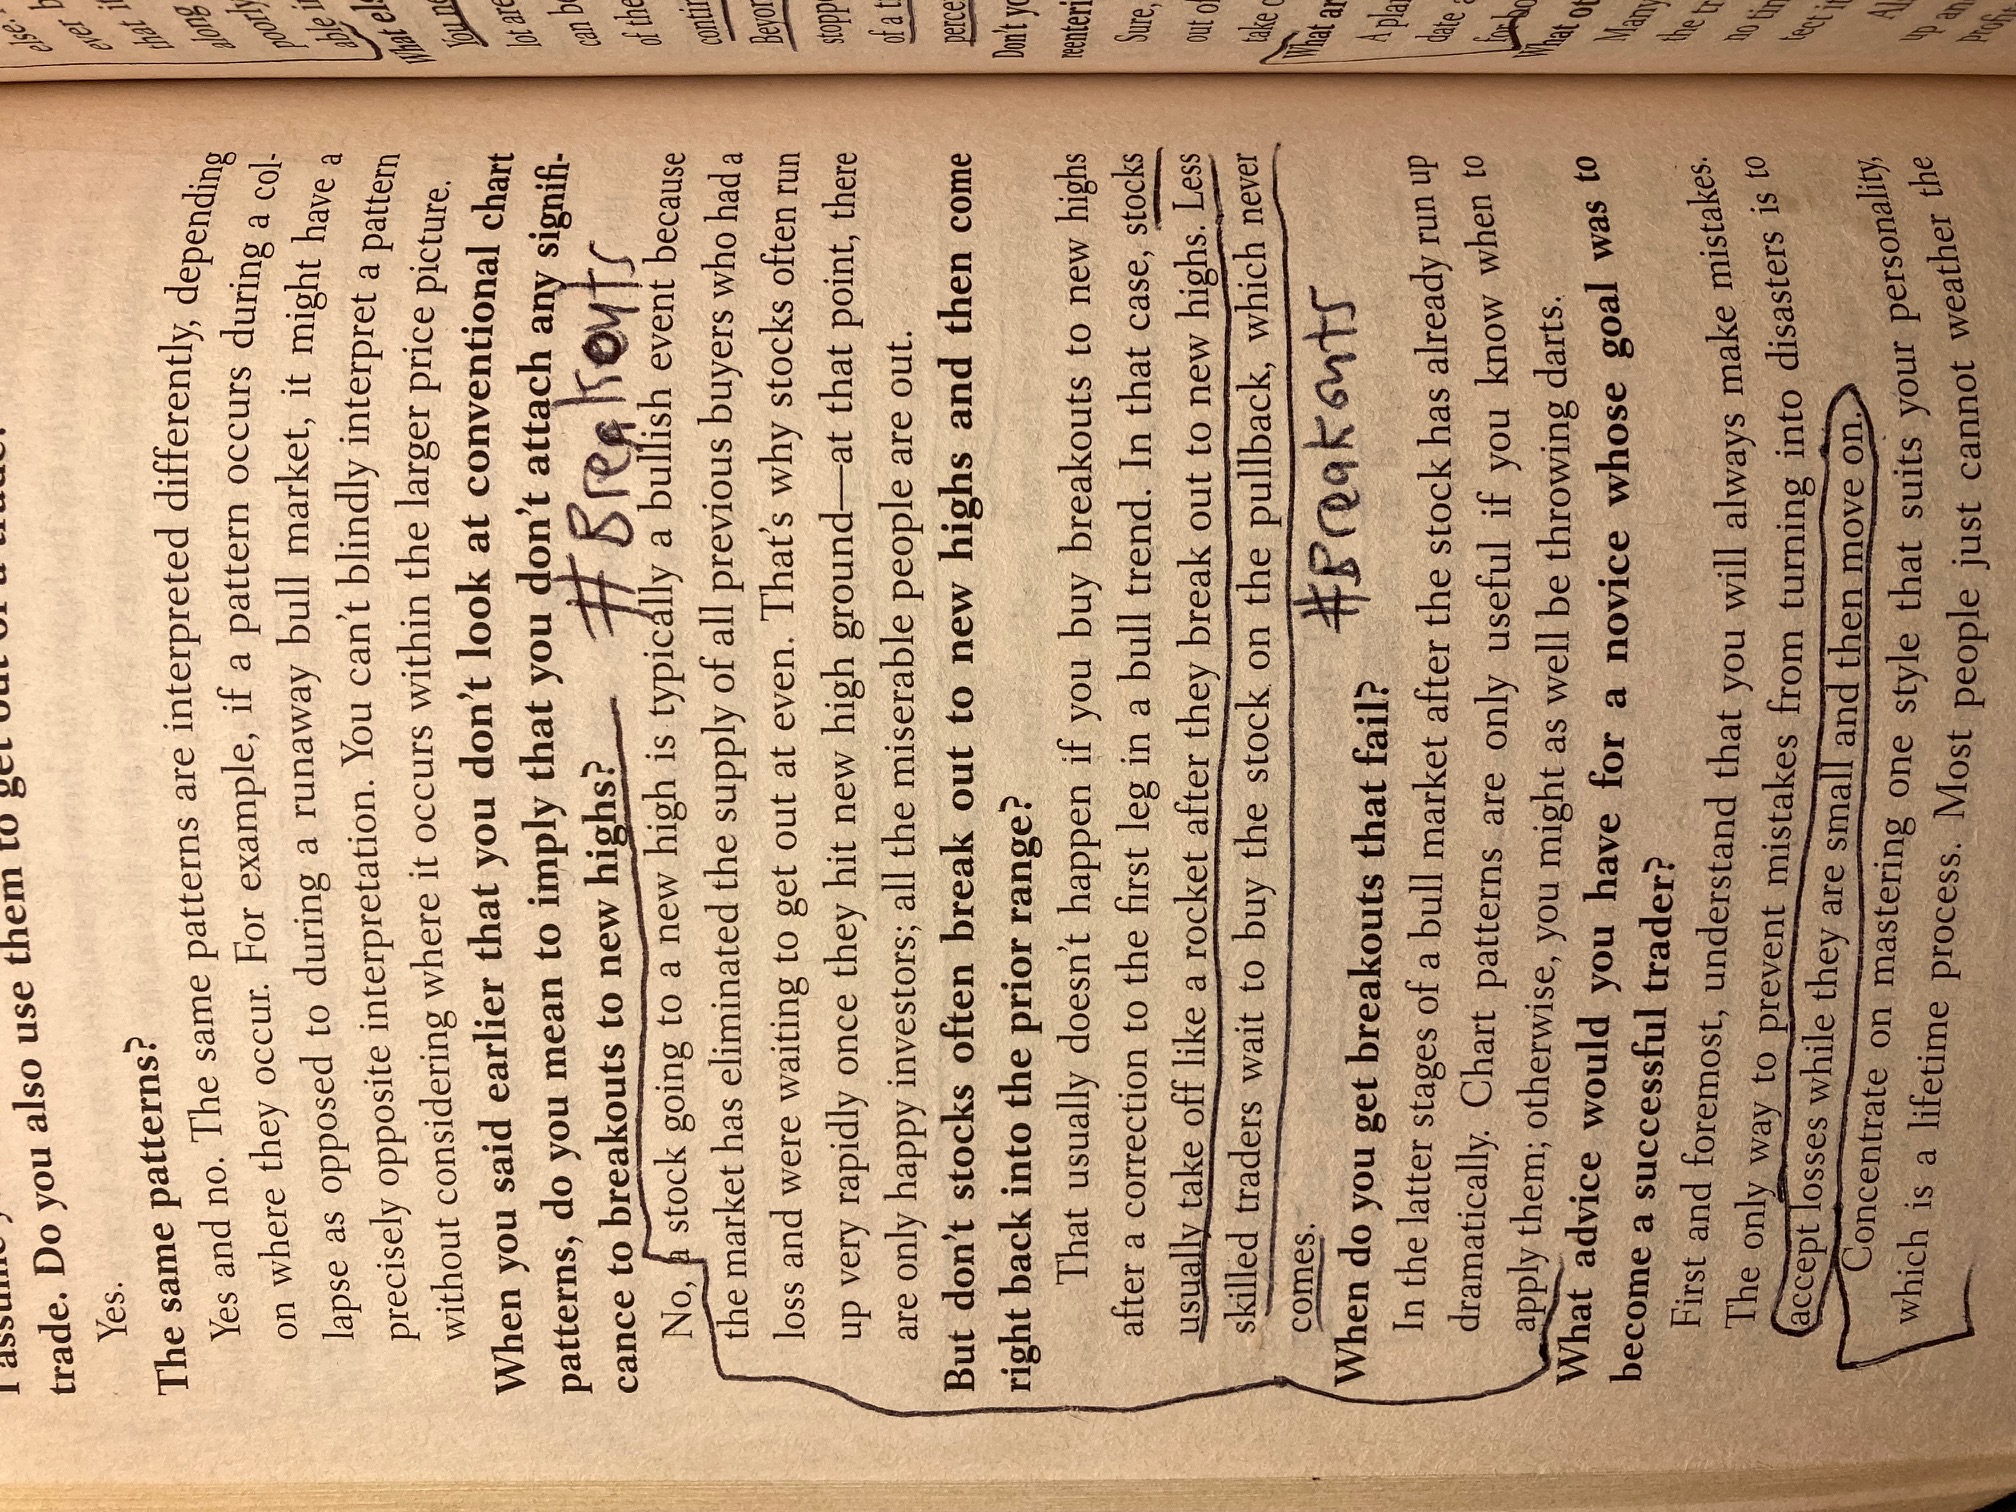
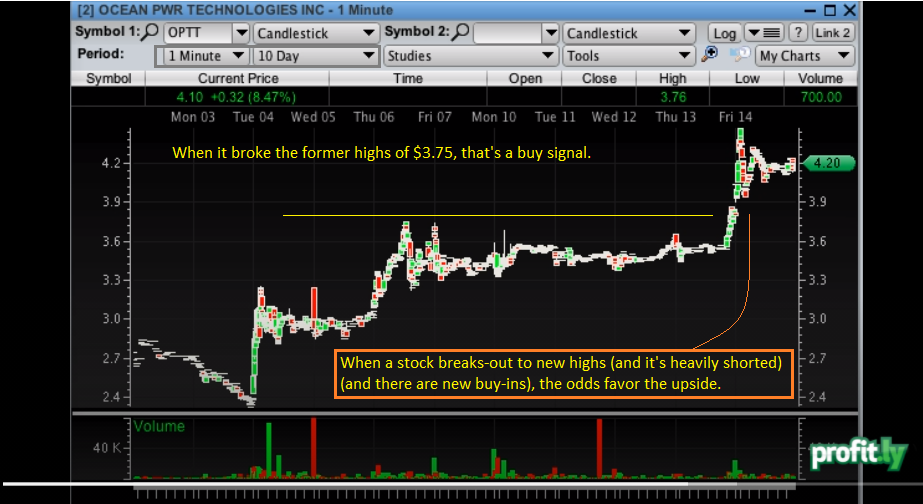
When a stock breaks out to new highs (and it's heavily shorted) (and there are new buy-ins), the odds favor upside (spiking).... -Sykes
Some trades / patterns take longer to setup, and frankly I like the ones that take longer because you don't have to be in and out in seconds. A multi-month earnings winner, a multi-month breakout with huge volume is something that is sustainable for weeks. These are safer plays than some low-float bullshit that comes crashing after a day or two. -Sykes
Even if a stock breaks-out by a few cents a share, it needs to hold that breakout, it needs to confirm it, otherwise it could be a fake-out...... -Sykes
Focus on breakouts. Focus on stocks that hold support. Or shorting stocks that break support. Stay away from choppy stocks. Only trade when there's a great setup. -Tim sykes
THE BEST PLAYS JUMP OUT AT YOU
- The best plays don't happen every day, but when they do, they are GIMMIES
- Have the patience to wait for plays with MULTIPLE indicators in your favor
- Buy stocks breaking out to new highs, with good news, in a hot sector, that's not over-extended
- Short stocks that are scams, up a ton due to manipulation and promotion, bound to come crashing down, not a question of "if" but when..
Buy a stock on consolidation only when the consolidation lasts a long time. Otherwise, a short-term consolidation will result into a fake-out (a fake-out breakout)....
Min 43 — focus on MULTI DAY BREAK OUTS starting out — watch all sykes Video lessons (4,000+), on multi day break outs — and DIP BUYING — https://m.youtube.com/watch?v=z9ZQ7-30TxE ......
[Best place to buy is...]
The best place to enter a long position aka] buying a stock is at a major key level of support.
Reason this is so important for beginners is because you have a CLEAR KEY LEVEL to base your risk. I'll try to give you an example through text..."wish me luck".
Lets say stock AB is at $1.50/share in the afternoon. You notice in the morning it spiked from 1.00 to 1.50 and since then has been consolidating between 1.50 and 1.35 (Key support).
Since it has based off 1.35 all afternoon its safe to assume this will be a good level to risk. There are two sides of the coin when it comes to long, you can either buy the dip (Meaning near 1.35).
OR
You can buy the breakout above 1.50 risking 1.35 (hence bigger range of risk).
There are many ways to trade. In some cases I would probably personally prefer the breakout rather than the dip but I know some who love DIP BUYING! -B the Story
Breakouts ------ they're easy to do, they're easy to spot, you just have to practice them........ #PATTERN...... -B The Story
I don't like buying stocks that spike and then lose all of their gains. I would rather them spike and lose SOME OF THEIR GAINS, and then they just have to be within shooting distance of their highs... I don't look to buy just any random weak stocks no matter how much they have recently spiked.. -Tim sykes #PLAYS #PATTERNS #BREAKOUTS
FACTORS TO LOOK FOR WHEN CONSIDERING BUYING A STOCK
-- is the market uptrending or dipping? Is the tape losing steam or increasing in upside momentum?
-- is there a press release?
-- is there a clear breakout?
-- is it holding near it's highs (support levels)?
-- is there high volume?
-----a lot of trading is being patient, watching the stock play out on your screen, ... and then sniping it right at the right moment.... . . . When shorts come into play, that leads to a hard drop in the stock price. . . ..
I focus on listed stocks, buying breakouts, anything under $10....... i'm basically a breakout buyer....... it's essentially the same OTC strategy, just adopted for the listed stocks....... -Matt Monaco
For OTCs, you still have to pay commissions ($5 or so)........ but it's well worth it..... When you see the breakouts and multi-day runs these things go on. . . -Matt Monaco
Min 36:45 --------- great patterns Sykes touches on, for me to replicate also | [first green day OTC: former runner, nice intraday breakout, nice multi-week breakout] -------- https://youtu.be/K39L5Ay0g-0 ............
Min 26:30 ----- The breakout pattern is what this guy depended on (to make him profits)....... back then there would only be 2-3 clean breakouts a month...... nowadays (2021) there would be breakouts every day----- www.youtube.com/watch?v=DbH7UYNNY08 ......
Min 32:30 ------ BIG PIECE OF ADVICE: only trade and track OTC and listed breakouts..... save yourself the heartache and failures of other plays...... do not take days off, watch the market everyday, everything will become instinctual and you'll be able to take advantage ----- www.youtube.com/watch?v=DbH7UYNNY08 ........
Min 25:50 - end------- on the scanners Jackaroo uses ---------- I'm never there capturing the morning spike unless it's already setup (if a stock is ripping up, i'll look for a play after it's had it's run)---------- www.youtube.com/watch?v=G1lHUwugw-A ............ I wait for these OTC breakouts for days, man #Stalks with Patience -[JACKAROO]
Min 18 -------- have patience for breakouts, but scalp other trades ----------- Tim Grittani ----------- www.youtube.com/watch?v=9BqMy3hPVXU ..............
Min 42 ---------- WHEN STARTING AT THE BEGINNING OF MY JOURNEY, focus on MULTI DAY BREAKOUTS at the beginning of my trading journey to grow my account... follow by then learning DIP buys...... (Tim grittani advice)!.... GRITTANI INTERVIEW ---------- https://m.youtube.com/watch?v=mDrcRDcjRCw ....... #pattern
After a break out, don't chase... only buy back in (dip-buy), when there's a massive panic......... -tim sykes
The best spikes are multiple days (of breaking out), and it all leads to the biggest spike possible and that leads to the biggest crash possible..... -tim sykes
Min 39 - min 41:30 —— how to play dip buys and breakouts — Roland wolf ..........Roland Wolf --------- https://m.youtube.com/watch?v=XY76jXe-Fk4........
SYKES ON THE FIRST PATTERN THAT MADE HIM HUNDREDS OF THOUSANDS OF DOLLARS
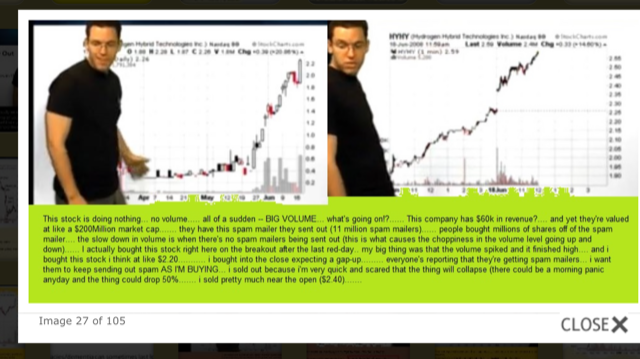
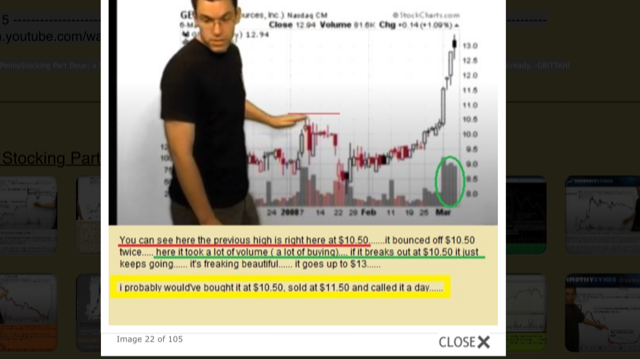
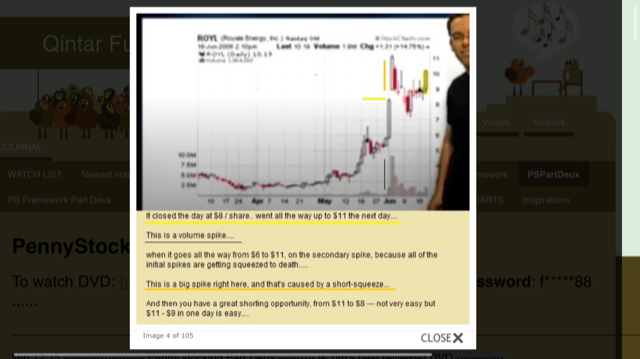
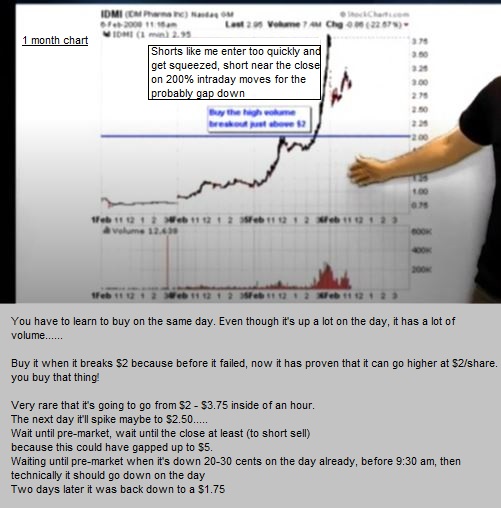
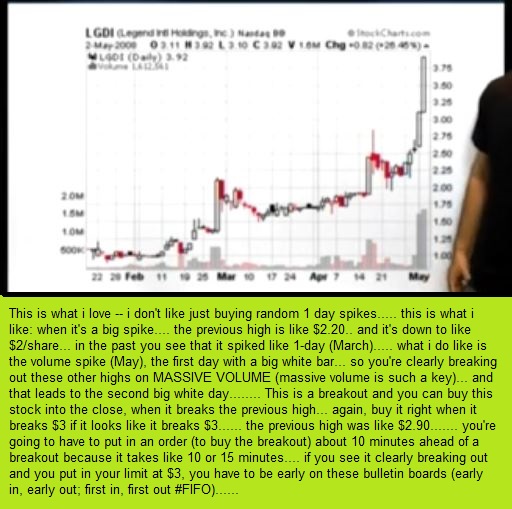
Back in 1999 and 2000, i made roughly over $700,000 (as a freshman in college and senior in high school), I was buying pumps into the market close, selling the next morning........ that was it. i had one strategy....... i just recognized peny stocks breaking out to new highs, i would buy it into the close at 3:50, 3:55 PM, and then i would sell it the next morning at 9:31, maybe 9:33 AM, and I would make 5%, 10%, 20%..... I saw this pattern....... it worked again, and again, and again......... usually stocks that were breaking out to new highs (actively traded) ideally with a catalyst --- back then, when a stock added .COM to their corporate name, the stock would spike 20%, people would see the press release over night and the stock would spike another 20% or 30% or 40% on day 2, and then another 20% or 30% or 40% on day 3 or day 4......... that was my whole pattern...... and then it disappeared............ there were no more breakouts when the Nasdaq died in 2000.......... it was a desert (like the day the dinosaurs died)..... there was a giant meteor that hit my pattern and it was obliterated... it forced me to adapt........i LEARNED why were these penny stocks spiking... that was when the SEC started exposing boiler rooms -- the reason they would gap up was because boiler rooms were calling people in the evenings and were pitching them penny stock schemes --- i was pennybacking pumps.............I made my first million buying the pump, i made my second million shorting the dump....... -Tim Sykes
BE SURE TO TRACK THE DAYS (DAY 1, DAY 2, DAY 3, DAY 4, DAY 5, DAY 6, DAY 7, DAY 8, DAY 9) THAT THE STOCK HAD IT'S BREAKOUTS CONTINUALLY.......
Min 37 --------- How to ensure a massive supernova spiker doesn't have many bagholders still in the stock (so it can keep spiking instead of selling off and tanking due to bagholders selling to break-even or minimize the amount of losses they're holding) -------- https://www.youtube.com/watch?v=zvs_8zF-i1E ..........
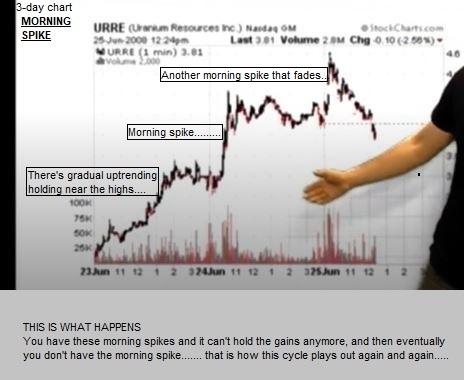
MORNING SPIKES ARE EASIER TO LEARN FROM THAN MORNING PANICS (DIP BUYS)The disadvantage of morning panics (for a dip buy) is that they're very quick. . . I think it's actually easier for newbies to learn from morning spikes, especially when there's two or three legs --- as opposed to morning panics where it's usually just one big crash and one big bounce all inside of like 5 or 10 minutes. . . -Tim sykes
TO PLAY OTCs --- always be focusing on liquidity ------- high volume scanner..... billions of shares traded...... HIGH VOLUME BREAKOUTS
Min 39 - min 41 — (multi-day spikes that are the best to focus on).... (the one day spikes are what the majority of short-sellers focus on & where they make their quick money)... https://m.youtube.com/watch?v=eWGNS_lCxos .......
TIM DOES NOT TRY TO CATCH STOCKS BEFORE THEY SPIKE
I don't care about any stock(s) before they spike. . . that initial spike tells me that they have news , they have a catalyst, they're in play ...That initial spike usually leads to several hours, or several days.... sometimes even several weeks of spiking. -TIM SYKES
Min 3:40 -------- find stocks that are spiking a little bit already #PiggyBack ------- it's very difficult to find the moment a stock starts to spike -------- https://youtu.be/cx1GjgNMLTQ ..........
Min 14 - min 18 ------------- Min 20 --------- piece the knowledge and info (with SEC filings and the stock's movement) ----------- EXPLANATION OF SYKES BUYING A MORNING SPIKE BASED ON NEWS ------ https://youtu.be/cx1GjgNMLTQ ...........
When you have BUY-INs, it doesn't matter how crappy the company is, the shorts have to cover... they have to buy........... (the stock could spike big)...... -tim sykes
The stock market doesn't reward solid companies, especially during a bubble. . . When you have volume like this (as found in a bubble), this is not rewarding "solid companies". . . This is the rewarding of solid pumps. . . The promoters deserve some extra cocaine for their (successful efforts). . The stock spikes in reaction to promotions. . . i want the promoters to do their dirty work, because that creates giant spikes, and I just trade the giant spikes. . . -Tim sykes
When a stock that's pumped by promoters spikes high, that does NOT mean it's a solid company, it means it's a successful pump & the promoters deserve extra coke for their efforts....I want pumps to spike as high as possible. I banked going long on all those pumps, thx promoters!. . I didn't short-sell any of these. . . -Tim sykes
[Morning spikes are where it's at. . . That's frankly how I'm doing so well this week. . . . I'm specifically going to be focused on morning spikes; morning panics just aren't doing it]. . . this is what trading is all about -- it's adapting. . . . If morning panics start working again, fantastic, i'll go back to morning panics. . . -Tim Sykes [circa Mar 23, 2021]
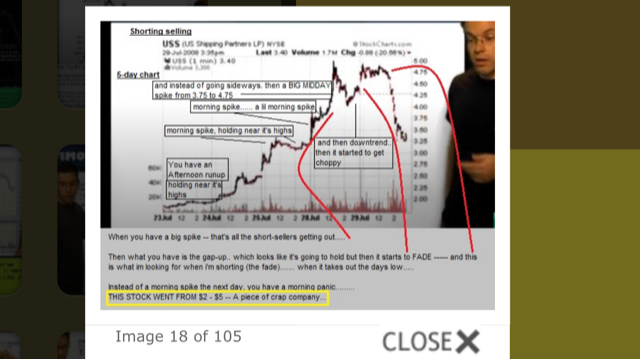
THE MORE VOLUME RESISTANCE THAT IS TRADED [I.E. heavy VOLUME candles located under previous/historic RESISTANCE levels] --- then the GREATER the PERCENTAGE your SHORT-SELLING PLAY WILL BE SUCCESSFUL..... the lower the volume resistance, when shorting, the lower your winning percentage becomes......... Take profits at around the 1/2 AREA OF THE SPIKE.... and do not hold shares overnight... -Dux
Trade the Stock, Not the Story
Knowing the story is just one step when looking at potential trades. You need to read PRs to make up your own mind.
A PR can spike a stock on pure hype. That’s not a bad thing. These can provide great opportunities for day trades.
And a company with real news can provide opportunities for longer-term trades.
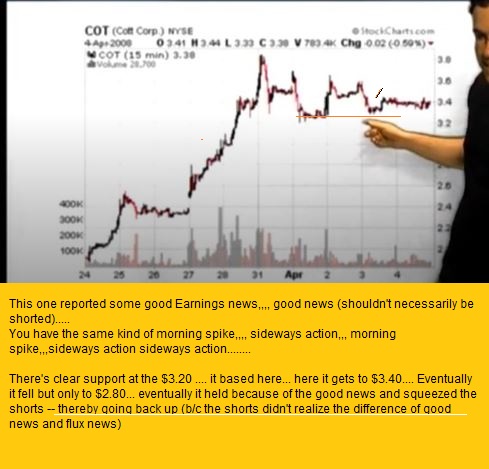
But remember, in the market, anything can happen. A hyped-up trash stock can spike huge on a short squeeze. And even a big new contract can receive a muted response.
So build your theory and plan but wait for the market to react. Don’t try to force your expectations on the market.
ON PROMOTERS PUMPING STOCKS
People think that the stock price (of a penny stock) is related to how good of a company it is. . . . NO NO NO NO NO!. . .The vast majority of these penny stocks will fail. . . The promoters like to blame short-sellers.. It is the promoters and the insiders who are selling into these run-ups. . . I'm so sick to death of these promoters saying, "never take a loss, just hold". . . they are trying to get people to hold their pumps (because otherwise their pumps would fall, it would be a house of cards collapsing). . . . . learn to sell into strength. . . you don't know how long the pump is going to last (unless you're in on the pumps). . . indeed, some of the worst companies CAN spike a lot. . but I'm so sick of these promoters trying to twist it, and say, "Look how much the stock is up, we're obviously a good company". . . it's my honor to cut through the BS and to teach honestly. . . -Tim sykes
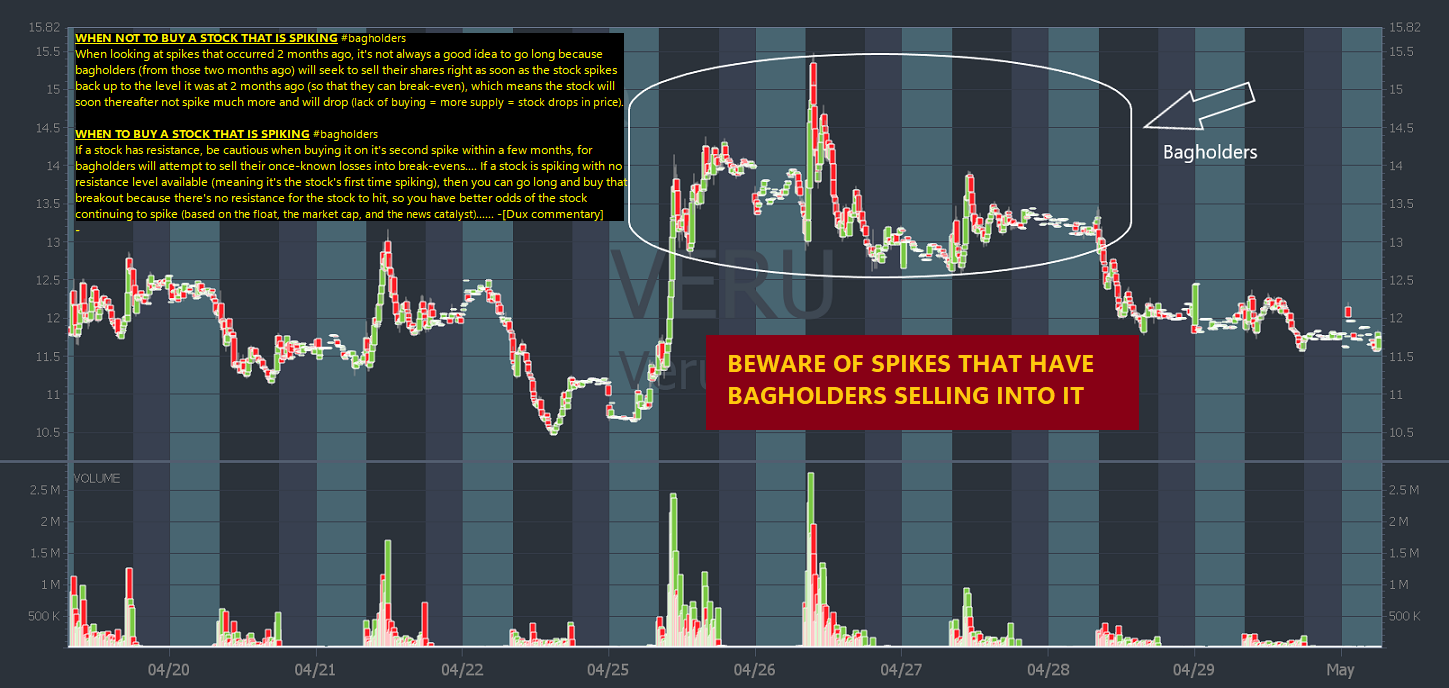
The bagholder "dream", in a stock that spikes recently, is to get back to break even. That's why you see these failed spikes over and over again. Because everytime it spikes back up (to prior support) the baggies start selling. . . . -Bohen
WHEN TO GET OUT OF A STOCK / TAKE PROFITS
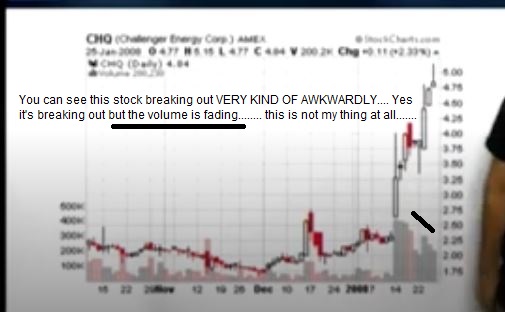
- Last, don’t fall for a snoozefest stock — especially on the long side. If a stock spikes but then continues to consolidate sideways for hours with fading volume, that’s a huge red flag! This shows the momentum’s fading.
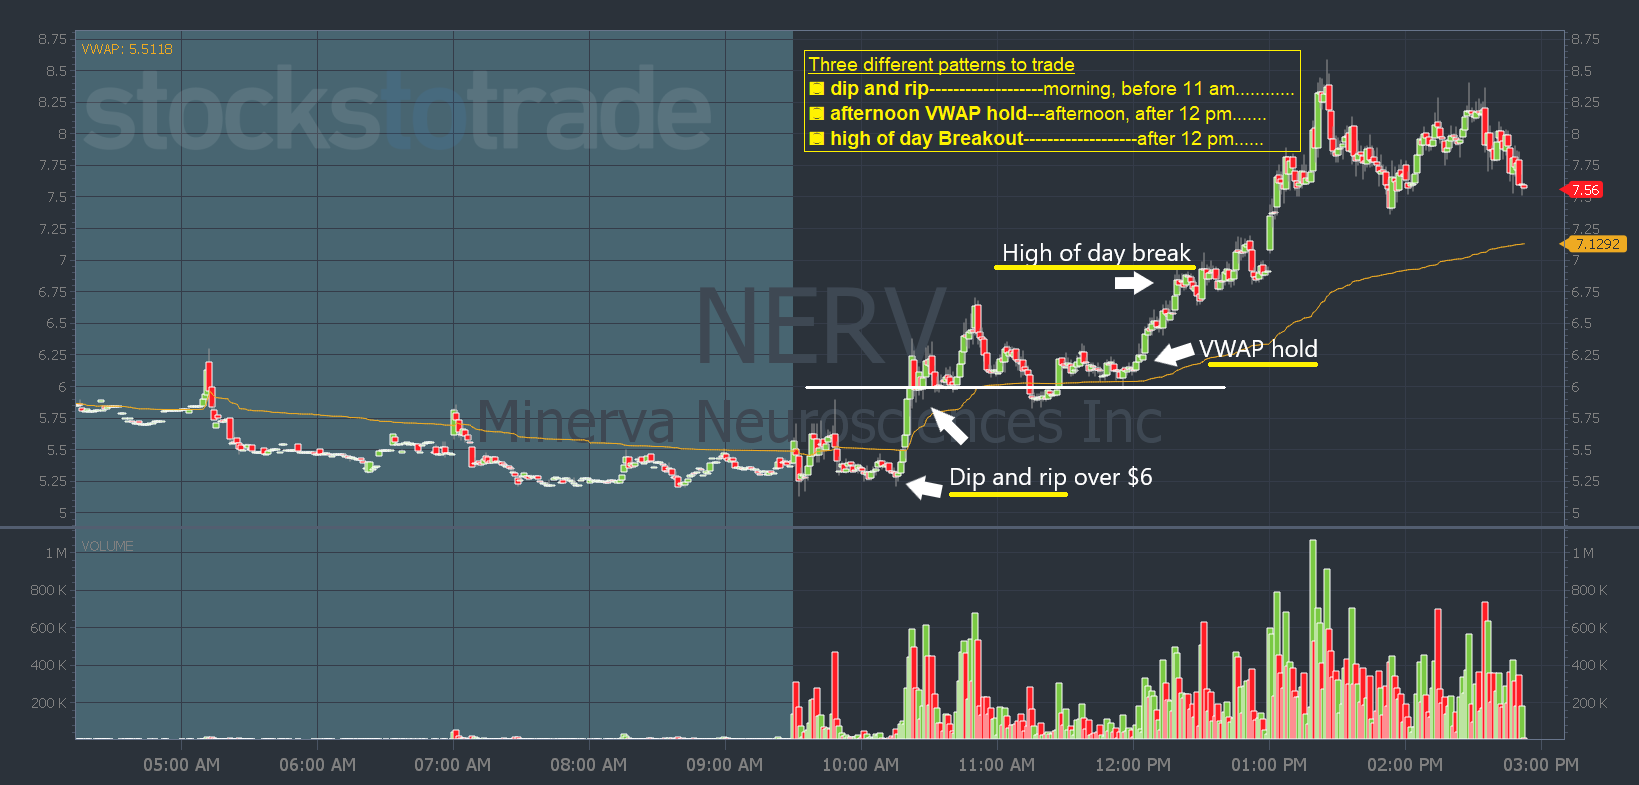
- If you don't have building volume and steadily uptrending price action … and if you haven't hit your goal … get out! ... You can always re-enter the breakout or come back the next day for either the dip and rip or VWAP-hold high-of-day break.
WHAT TIM SYKES FOCUSES ON
I always focus on BIG PERCENT GAINERS and recent Big % gainers. . . . . and the longer you do this, you start remembering big % gainers from a few days ago, from a few weeks ago, from a few months ago. . . Because if there is a big % gainer that spikes 5up again and again and again, I'm going to trade it again and again and again.. -Sykes
You'll realize that singles really do add up. . . ..I see a lot of similarities between the Bitcoin promoters and the pump-and-dump promoters. Both say, "you have to hold!". . That is a lie. That is a blatant lie. . . It's not about holding on for dear life on any play. Especially for crypto. . . All of these plays, you just do not hold and hope (for it to spike back up). -Sykes
Every single penny stock, every single OTC stock that spikes big --- you should never believe in these companies.. . Expect the worst of every company all the time, and you'll never be disappointed. I don't mean to be cynical, but this is what happens after you see this stuff for 20+ years. -Sykes
WHEN TO BUY A STOCK END OF DAY --- LATE DAY SQUEEZES
You have support getting higher and higher.... and there's resistance, it's getting a little higher too.... so you have higher highs, higher lows, and a potential for a MONSTER short squeeze... also how many days has it been spiking -- 4 days... so you're going to have buy-ins coming tomorrow and the next day (potentially)... With high volume as well..... This is an explosive situation... [past spikes]... [press releases]...... [risk reward is good]........ [finishing near it's highs]...... You have a lot of indicators, you gotta trust the indicators, they work time and again..... -Sykes
KEY TIP
If you're going to have these big pie in the sky moves, you're going to have some uptrends first. . . . You don't need to be first. . what I've learned is that the biggest percentage moves in the stocks that I trade, happen after they've already hit several technical scans (they're up 20%, 30% on the day with good news), and the biggest runners take several days, several weeks, several months to spike. . . #patterns -Tim Sykes
- In the stock market, history always repeats itself........ when a stock has so many failed spikes in its history, that's why the stock doesn't hold it's spikes very well (b/c people see it's history).......
- pre-market spikes seem to replace morning spikes after the market opens...... (if a stock spikes pre-market, it likely won't spike at market open).........
I don't like stocks that spike and then lose all of their gains. . . I would rather them spike and lose some of their gains, and then they just have to be within shooting distance of their highs....... they're potential re-buys if they can show better signs of bottoming and ideally some news to re-spike the stocks otherwise they're weak, weak, weak, weak, weak and i don't look to buy just any random weak stocks, no matter how much they have recently spiked. Especially if they have news, I'm looking to see which ones can rebound. . . . -Sykes
AFTERNOON PLAY
Min 12:30 - 13:30 ------------ The more time a stock fails in spiking, but holds support, the more powerful of a spike it is when it shoots through resistance........ any stock that has multiple green days in a row, if they fail hard in the morning then you have to trade it in the afternoon (the morning panics that yank hard and then slowly trickle up during the day, if they start getting high volume, then they can shoot up big at the end of the day) --------- www.youtube.com/watch?v=RQFSsQvBMP4 ............. -Bohen
OTCs don't trade pre-market, so that creates a lack of volume until the orders are made during open market hours (then the volume spikes at the same time as the tape goes up)........ thus it's tough to predict OTC spikes solely based on VOLUME in pre-market (which doesn't exist)...........
GREAT TIPS ------- Min 13 ------ www.youtube.com/watch?v=bGWsGj0mkrU ........... The stock's that look the cleanest (within a few days period) and HOLD on their HIGHS, are the one's worth longing / buying into....... do not trade choppy stocks........ You want to be focusing on charts that are really clean....... when stock's can have morning spikes, and hold above VWAP all day, and when you get volume, and the stock holds with consolidation, this just super clean action which can lead into a spike the next day........ the stock should trend like an OTC: pop up, consolidate, pop up, close strong, sideways over VWAP, pop, sideways consolidation, holding the high, pop, holding...... stock's that can hold on consolidation then pop up --- these are the one's that work, these are the one's you need to be focusing on........... #Watchlist . . . . -Jackaroo
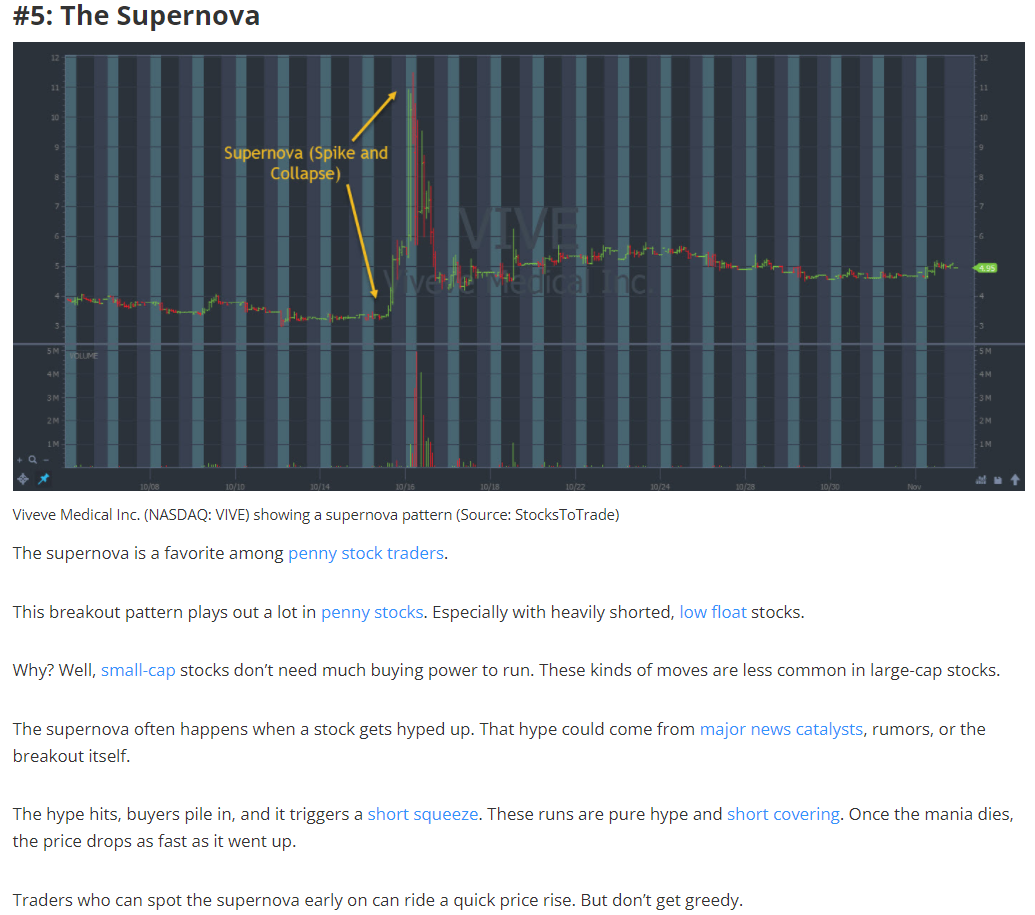
For supernova pattern plays -------------- watch ------------- """"Bootcamp Day 13: Penny Stock Patterns – Supernova"""" --------> https://members.timothysykes.com/login/ | Sn: saloul10@gmail.com | Pw: pduyygaj............
SHORT-SQUEEZES = SUPERNOVAS
Full-on supernova moves are only possible with a squeeze. And you probably already realize that a squeeze is a buyer’s best friend but a short’s worst enemy. Short squeezes can grow in size when the right conditions exist. The most significant moves in the market happen when everyone’s on the wrong side of a trade. Most short sellers are right … in the long run. But when you forget the market and the players involved, it can set you up for disaster. I quit shorting years ago because the strategy stopped working for me. The trades are too crowded, and the squeezes keep coming.
I don't necessarily recommend chasing big run-ups (supernovas) but you can trade it for bounces (buying at key levels of support and resistance #sniping)...... -tim sykes
SUPERNOVA stocks have these characteristics
- UNDER $5
- LOW FLOAT
- HAS STRONG NEWS (CATALYST)
- A LOW AMOUNT OF SHARES OUTSTANDING (needs to be low, like 1 MILLION, or LESS THAN 1 MILLION)
- A HIGH SHORT FLOAT INTEREST (anything over 20%. . . .creating a short-squeeze, and thus supernovas)
SUPERNOVA Characteristics
- a hot sector
- a big % gain already (up 10,20,30%)
- a news catalyst
- low float
- good volume
_________________________________________________________________________________________________________
QUESTION: could you explain to me what you look for as an entry for a First Green Day?
MARIANA: down a few days, former runner, and see it hold green on the day with good volume and possibly news.
QUESTION: so its more about the daily candle, than where the stock bounces off of ?
MARIANA: like a combination of all, but the more down the better for the bounce, and also where previous support is
QUESTION: would you be in play only during FGD or it could also be potential swing if it holds?
MARIANA: could also turn into a swing if i think it has potential to bounce more
QUESTION: when looking for a First Green Day, I understand the importance of reviewing the stock's history and seeing how it typically moves, but i want to make sure I fully understand the criteria for an entry. I know you look for old resistance levels to become support for the bounce. So are your entries based on trend reversals around those levels (Aka higher lows)? Or are you trying to grab them as close to the support levels, risking previous day’s lows? Basically, are you waiting for the First Green Day to establish? Thank you
JACKAROO: Yeah, so basically I just wait for key levels to try and get the best price, and I use the history of the stock to see where the key levels might be. I take my position and like to see it start working in my direction and if not, I'll exit my position.
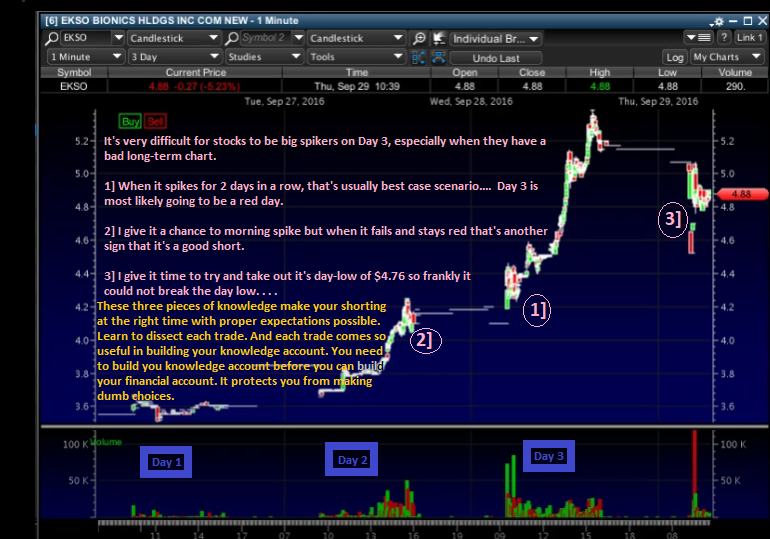
GREEN to RED ---------- If you know about two green days, usually the THIRD DAY is a red day. . . [Min 9:30 — https://bit.ly/3uPoCjI]....... -Sykes
let me tell you a little secret … A stock can run for days but usually fails (only) once!
That’s a big reason why I don’t like the sketchy biotechs that pop on news.
I prefer stocks that show me over a series of days, if not weeks, that they want to move higher.
Many traders struggle to find these stocks for two reasons:
- Multi-day runners have news that dropped before the current trading day
- Traders miss the trend reversal
When you see TWO or THREE big green days on penny stocks, understanding that the odds dramatically flip on DAY THREE (to the odds favoring it being a RED DAY)......... day 3 odds of the stock going RED are huge.......For the first 2 green days, you gotta be long biased........... The vasty majority of times, day 3 is a RED DAY........... -Tim Sykes
A fourth green day for me is excessive... . . I don't even like chasing even three green days. . . -Tim Sykes
Min 14:45 -------- not holding a stock overnight on it's third green day........www.youtube.com/watch?v=GD0AOpksmw8 ............
I like buying FIRST GREEN DAY stocks....... the first green day is defined by a big percentage gain (20%, 30%, 50%, 100% on the day)... ideally with a news catalyst [good earnings] [they won a contract] [they're in a hot sector]........... I don't like buying so much on day 2 or day 3 because it's already gone up so much.... -SYKES
FIRST GREEN DAY breakout patterns ------------- www.youtube.com/watch?v=1oOcAMIFUMA...............
- New 52 week high
- Volume
- Introducing new product
- Good earnings
- Closing strong
- Sell into morning spike
- Sometimes you can sell before market open if goals are met
Categorize my statistics based on Grittani's Trading Tickers 1 (PART 1) DVD in it's last 4 minutes! how he does it there is exactly how i gotta track stats and summarize them then into categories into a separate stat sheet!How to track GAPPERS / %GAIN DAY 1 statistics (onwards) ------------ categorize my statistics based on Grittani's Trading Tickers 1 (PART 1) DVD --------- Min 3:55:00 ..........................
Min 5 ------- don't try to find stocks before they spike..... you want it to spike first (when it has it's first GREEN DAY on some news, then i say "can it spike some more"....) --------- www.youtube.com/watch?v=gm5kZy2pLG8 .........
The best indicator for a second green day, is a FIRST GREEN DAY...... And usually big volume, big percent gain, anything with a catalyst. . . .......... so the stock really spiked. . you don't need to be there the second the stock spikes. . This is the easiest niche in the entire stock market. -Tim Sykes
Min 7 -------- look for GREEN DAYS (one, two, three continual green days), and INCREASING VOLUME on OTC stocks ------ If a stock holds half of it's spike, it'll likely spike up again ----- www.youtube.com/watch?v=n6VkslzWxSo ........
I always warn that 3rd green day patterns are tough......... -Sykes
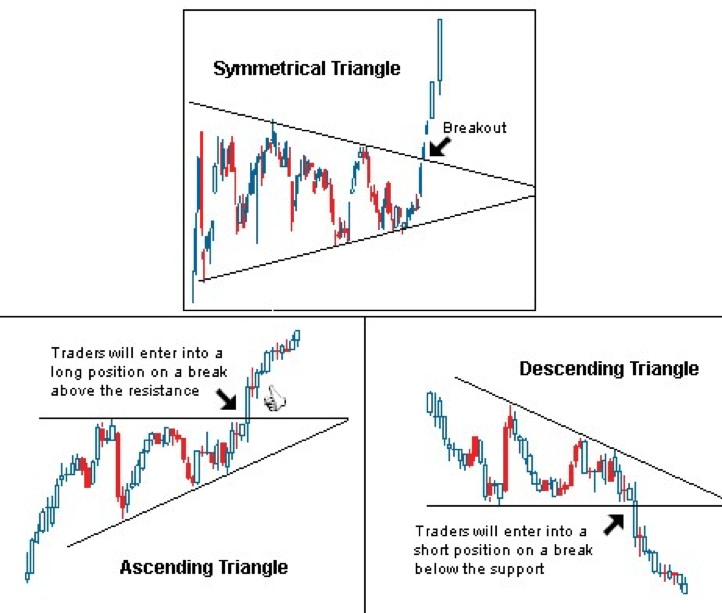
TRADING BREAKOUTS {SWING TRADING BREAKOUTS}
If you study thousands of the biggest winning stocks over the past 100 years, they tend to move in stair-steps... Meaning they will make a 20-50% move, pull back, and go sideways for a while, and then make another move... KRISTJAN #QULLAMAGGIE uses the daily chart, initially (scanning for) a big move within the last 12-weeks ideally moving between 30-100%... the next step is to look for an orderly pull-back into consolidation (running for a time length between 2 weeks and 8 weeks... the consolidation is based above the 10 MA, which is higher than the 20 MA, which is additionally higher than the 50 MA (50 MA is at the bottom, 20 MA in the middle, 10 MA above both, with consolidation occurring above the 10 MA)...
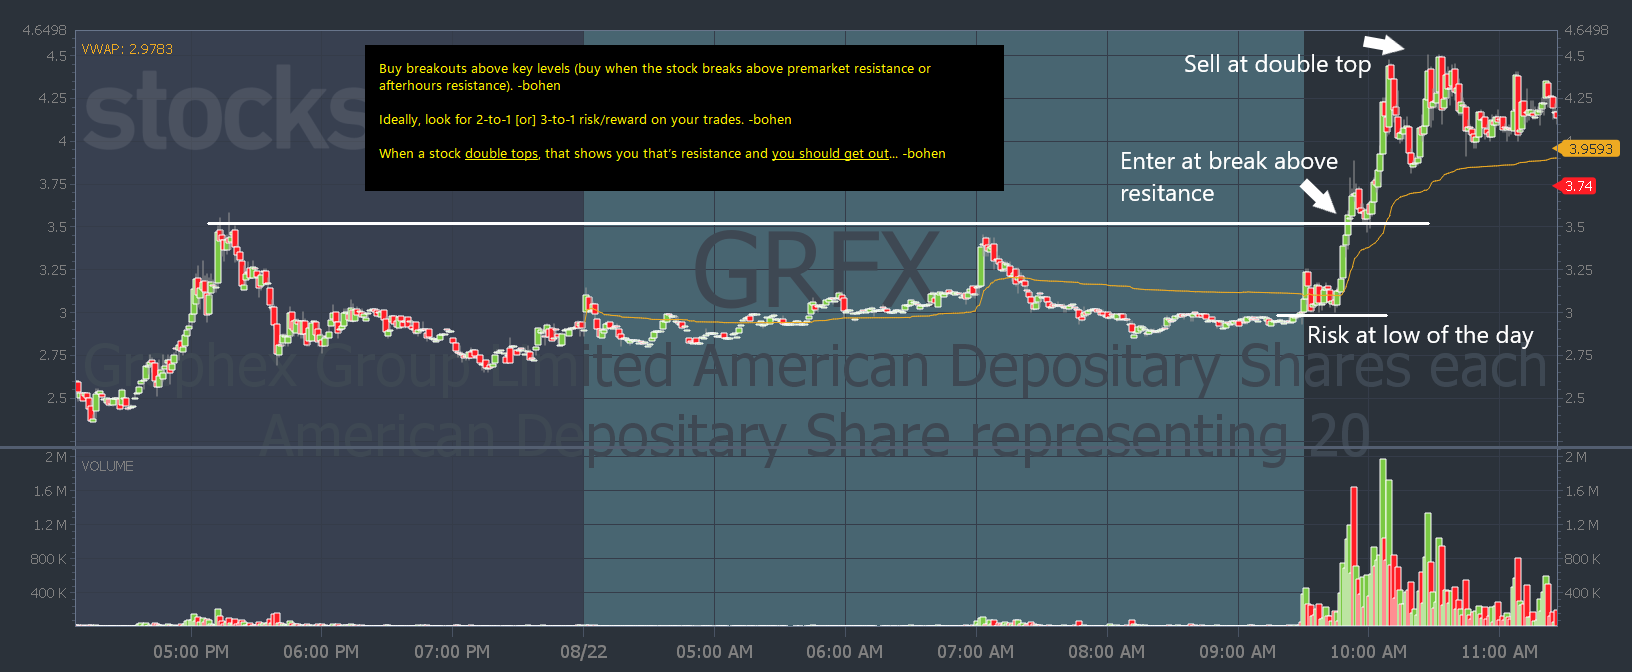
‣ KIRSTJAN's advice is to enter the long-trade as the stock starts to breakout of consolidation... QULLAMAGGIE says, "It's all about finding tight, high probability areas to enter, so you can have high risk/reward on your trades."
‣ He uses the LOW OF DAY (of the day he entered the stock on it's breakout out of consolidation) as the STOP LOSS (ensuring additionally that his STOP LOSS is surely never more than the average true range of consolidation (i.e. if the average true range of the consolidation phase is 5%, then the stop loss should never be greater than 5%...
‣ KRISTJAN then recommends selling between 30% - 50% of his shares within 3-5 days after entering the trade, while then moving his STOP LOSS to BREAK-EVEN (the same price he ENTERED the trade at).....
‣ The remainder of the position should then have a TRAILING-STOP governed by the 10 MA or 20 MA, depending how the stock moves (so that if the stock is doing well each day, abiding by using the 20 MA as it's support level, then SELL THE REST OF THE POSITION on the initial day that a WHOLE RED CANDLE has formed underneath the 20 MA line..
KRISTJAN QULLAMAGGIE says, "I'm a swing trader, and use the daily chart to find these setups, but these setups also work on the weekly charts and the intraday charts."....... His ultimate aim is to achieve minimal risk with maximal reward (low risk, and the potential for high multiples of exponential reward).....
QULLAMAGGIE says, "It's all about making 5-20+ times your initial risk. You can be wildly profitable with having just a 25-30% win-rate. It's all about having small losses and big winners." ...
It's fair to say KRISTJAN's primary focus is on money management, and the concept of risk/reward. The setups themselves are secondary, and not groundbreaking. In fact, KRISTJAN says, "a lot of great traders trade the same setups because they work, and have done for a hundred years."....... Fundamentally, trading is a numbers game; a game of odds. And the more that we can move the odds in our favor, the more margin of error we can absorb, and this is where risk/reward becomes the major factor...
KRISTJAN suggests his win-rate is 30%, often coming in clusters (losing 1% of equity on losses, and winning 10% (thus, his losing 7 trades in a row means he's lost 7%, while him winning just 3 trades in a row equates to a 23% cumulative profit overall. Such an approach provides considerable margin for error (if he loses 9 trades in a row, and 1 winning trade, he still has an overall profit of 1%; thus even under performance CAN BE PROFITABLE; the key is keeping losses small and letting profitable trades run.......... A lower reward means that the margin for error is far less, albeit still profitable (losing 7 trades in a row at 1% of total equity, and profiting only 4% whilst winning 3 trades in a row still puts you at a +5% profit among the 10 trades; however the margin for error is less...... an improved RISK/REWARD ration allows for the accommodation of more losing trades.
KRISTJAN QULLAMAGGIE says, "My trading journal at times is mostly a sea of red and then there is a big winner here and there.".... This is what trading is all about. You can be wrong 8 out of 10 times, and still make money. It's all about risk/reward, and using a particular chart pattern to provide rationale for improved probability. [source: www.youtube.com/watch?v=WswZwmr2ebU].\
_________________________________________________________________________________________________________
PUMP AND DUMPS
When you have illiquid pumps, and you have buy-ins, and you have a short-squeeze, it's just difficult to guess the top of the tape (where the stock will reach).... Buy-ins typically happen toward the end of the day...... You never know how far short-squeezes can go and it's very difficult to guess the top....... -Sykes
Promoters are not paid by the company (to pump the stock)... they're paid by some third party... and in the disclaimer of the promotion, they say the third party can sell shares whenever they want.... -Sykes
There's always going to be opportunities.... because small companies have to hype themselves up, for TWO reasons:
1) The insiders are going to pump up the stock, and sell their shares at inflated prices.
2) They're going to pump up their stocks so they can raise a financing ,and they can pay themselves within inflated salaries for years while making it look like they're actually trying to build the company even though they're just milking the company for salary/bonuses/expenses.
The true pump and dump promotions, after they're done, go right back down to their lows (penny levels). . . . Oft times, people believe that companies shoot up because they're sound companies. . it's the promoters. and I've given the promoters their props several times. . . (all you need is StocksToTrade breaking news to spot promos and other breaking news). . . -Tim sykes
____________________________________________________________________________________
Along with tracking the FLOAT and the MARKET CAPS --------- note if there is SSR (short sale restrictions) ------------- SSR can help the stock SPIKE --- when the #SSR is on the ticker ON THE FIRST GREEN DAY, the ticker leans toward being BULLISH ................ -Dux
SSR (short-sale restrictions) only last for ONE trading day typically. The next day things are back to normal..... #SSR means that (a trader) can't execute short orders at the moment due to volatility.
DAY 2 MOVES
QUESTION: curious why ($_ _ _ _) isn't something you're playing today. Too wide of risk when it sets up?
BRYCE: I don't personally like day 2 moves
QUESTION: does the fact it had a big day 2 move make it less appealing for a day 3 move?
BRYCE: Yes, correct
Min 1 - min 2:30 --------- explaining in details the process of a chart's volatility movement ----------- www.youtube.com/watch?v=Ao0ppE5-T6Q ............. #KyleWilliams
must watch
- This Is the Training You Need to Spot Supernovas! -- www.youtube.com/watch?v=ewY1IQrvrbw .......
- How To Recognize A Supernova Play -- www.youtube.com/watch?v=kZFG3V_3ZkU .......
- 3 Times To Buy Crazy Supernovas -- www.youtube.com/watch?v=RoYtlEKdz_M .......
- https://www.youtube.com/watch?v=pd_u2AcsiYU ............
- Review my notes on Dux's DVD regarding "breakouts" ----- here.

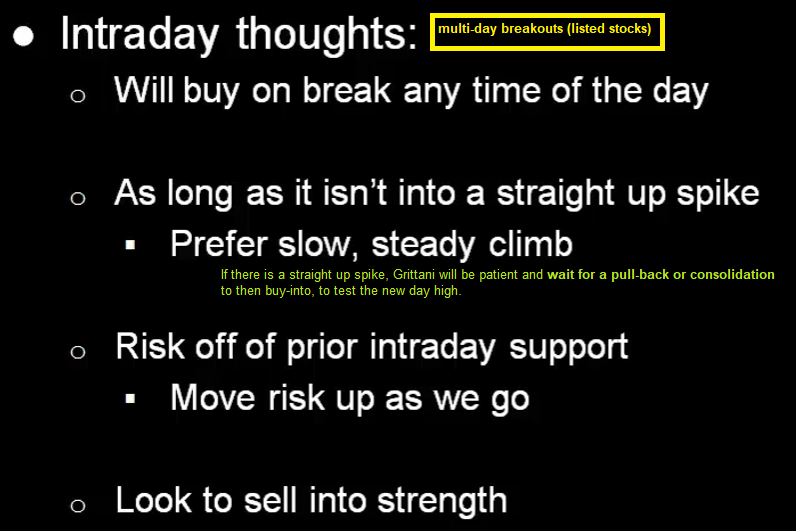
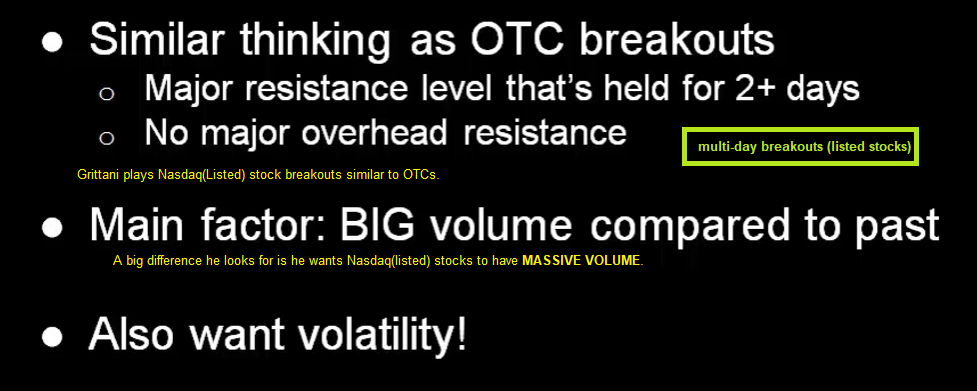
HOW GRITTANI BUYS NASDAQ(LISTED) BREAKOUTS:
.PNG?timestamp=1639038172158)
Min 40 - min 43 -------- A breakout is more of a marathon than a sprint.. they don't shoot up right away... OTC breakouts -- you need to set your risk beneath consolidation where the potential breakout level exists ------ www.youtube.com/watch?app=desktop&v=XY76jXe-Fk4 --------- #RolandWolf #BREAKOUTS
Min 9 - min 15 ---------- Don't chase the breakout -------- intra-day vs daily breakout --------- CHARACTERISTICS to look out for ---------- www.youtube.com/watch?v=4iE88A_O-R4 ............ #BREAKOUTS
Second :30 — how breakouts actually happen over time (they don’t shoot up right away, rather it’s a slow process)........Roland ------ https://m.youtube.com/watch?v=6zBm9LUeoyM........ #BREAKOUTS
Min 29 ----------- Grittani on multi-breakouts, how to play them------------ www.youtube.com/watch?v=mr9F5PADkV8&t=793s ............... #BREAKOUTS
Predicting breakouts ------- https://www.youtube.com/watch?v=QGoLN96KIDI ......... https://www.youtube.com/watch?v=7RbjGk9eNJU ......... #BREAKOUTS
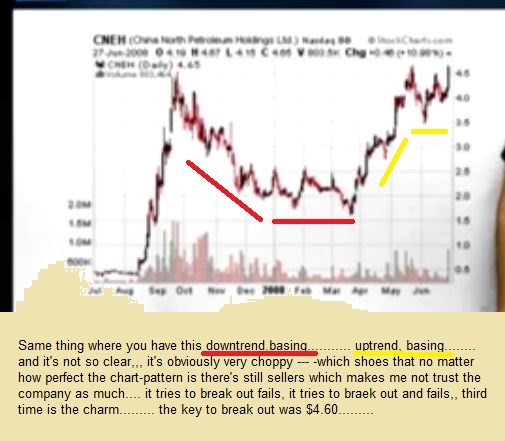
Min 39:55 - Min 43 --------- The process of how BREAKOUTS work (the psychology behind it all) ------- Everyone is in the stock for the breakout -- the breakout POPS UP --- everyone sells for profit --- the stock goes back down --- all of the breakout buyers remaining then sell (that 90% lose) ---- then Roland comes in and buys the stock if it supports the breakout level (and that's kind of when the short's are covering when it isn't cracking; they cover their shares (they buy back in), and Roland rides the dip-buy momentum upwards) ------- www.youtube.com/watch?app=desktop&v=XY76jXe-Fk4 ....... [WHY BREAKOUTS ARE CHOPPY] #BREAKOUTS
Min 4 ---------- when a stock fails to breakout convincingly, cut your losses................. don't chase non-convincing breakouts ------------- www.youtube.com/watch?v=u85bZC7SK90 .......... #BREAKOUTS
-
My friends laughed at me when I said it. 'I don't mind cutting losses when I'm in the green" but my mindset was, yes it's going up but its not moving like I planned so I'm gonna get out before it does something else I don't expect. Top notch video, Tim! [42 likes]
RISK / REWARD
if I'm buying the stock at $3.80 and support is $3.40, my risk is 40 cents per share............. support doesn't change... ... risk is not wherever you decide it is. It is support! ............ when a stock drops quickly, you just need to learn to act quicker, and react (cut your losses quick)..... -[Sykes commentary]
HOW TO SET RISK FOR BREAKOUT PLAYS
I need to set my RISK level at where consolidation holds (so as to give the break-out enough room to let itself "break out" (in other words, do not set my risk level at the breakout level price --- set it below at where consolidation happens so that I'm giving the "break out" potential enough room to breathe and vroom (upwards). . . -Roland Wolf .... #BREAKOUTS
Min 7 ------ on FDA plays --------- "i don't play them at all" -Grittani -------------- "very speculative / risky" -Sykes ----------- www.youtube.com/watch?v=9BqMy3hPVXU ............ #BREAKOUTS
Min 41:20 ------- where to set my STOP LOSS on the BREAKOUT pattern ----------- https://youtu.be/XY76jXe-Fk4 ........... #breakouts #rolandWolf
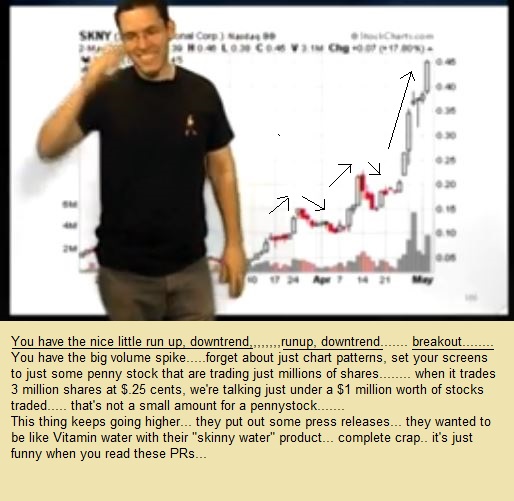
ACTION---------Set your technical screens (scanners) to pick-up big VOLUME spikes........ #ForFindingBREAKOUTplays -Sykes #BREAKOUTS
Min 17:45 --------- Min 20:30 -------- how to know if a breakout is going to happen or not --- what is the small cap market doing / condition like? ------ www.youtube.com/watch?v=cjc2yzqh9yw ... #RolandWolf #BREAKOUTS #RISKMANAGEMENT
VIEW MY NOTES I TOOK OF DUX'S TRADING TECHNIQUES DVD --- it covers breakout patterns like "the pre-market breakout" and "multi-day/week/month/year" breakout patterns... #BREAKOUTS
Breakouts have the highest potential upside among trade setups. -Mason Fecht #BREAKOUTS
Is it a BREAKOUT? Multi-month and multi-week breakouts happen more often... Multi-year and multi-day breakouts happen less..... [The longer the timeframe of the b/o, the more convincing the breakout... (ex. a year-breakout level is more powerful and has much more momentum to spike than a week-breakout)]. -Dux ... Don't just buy a stock with solid news, you need a technical breakout to accompany the news. -Sykes #BREAKOUTS
 WOW — how I can potentially make $10,000,000 off of just ONE TRADE (in OTCs), is by catching them early and holding until it spikes huge — https://m.youtube.com/watch?
- a Multi-day runner
- Holding near its highs
- a Low float
- has Great volume
- a Multi-day breakout
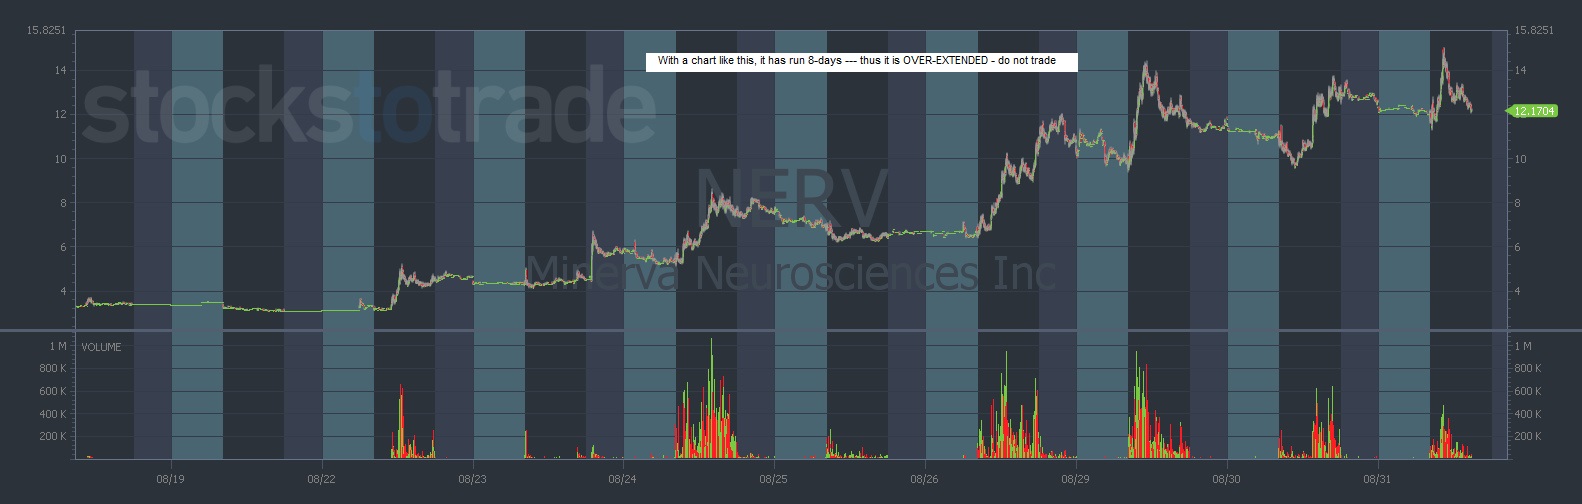
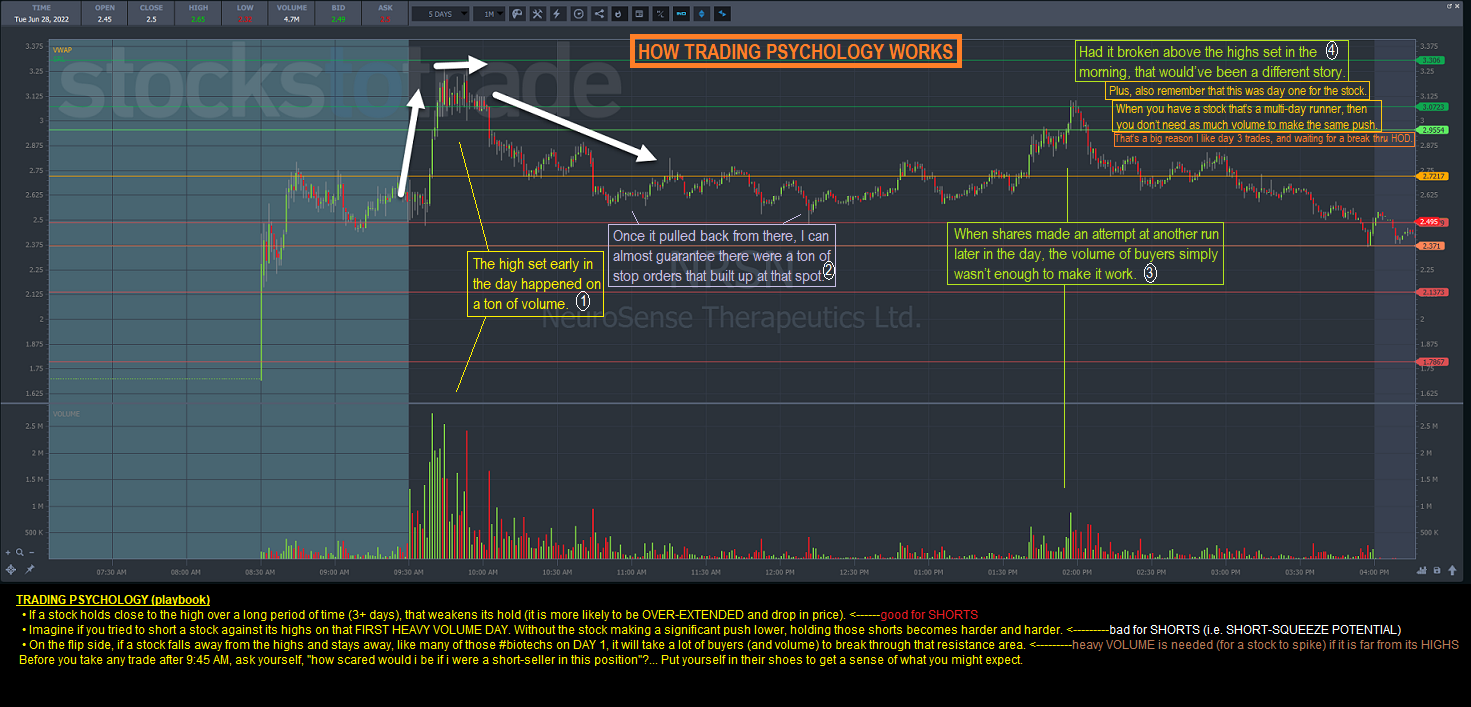
• If a stock holds close to the high over a long period of time (3+ days), that weakens its hold (it is more likely to be OVER-EXTENDED and drop in price). <------good for SHORTS
• Imagine if you tried to short a stock against its highs on that FIRST HEAVY VOLUME DAY. Without the stock making a significant push lower, holding those shorts becomes harder and harder. <---------bad for SHORTS (i.e. SHORT-SQUEEZE POTENTIAL)
• On the flip side, if a stock falls away from the highs and stays away, like many of those #biotechs on DAY 1, it will take a lot of buyers (and volume) to break through that resistance area. <------------heavy VOLUME is needed (for a stock to spike) if it is far from its HIGHS
Before you take any trade after 9:45 AM, ask yourself, "how scared would i be if i were a short-seller in this position"?... Put yourself in their shoes to get a sense of what you might expect. -Bohen #TradingPsychology #ImportanceOfVolume #short-squeezes #squeezes
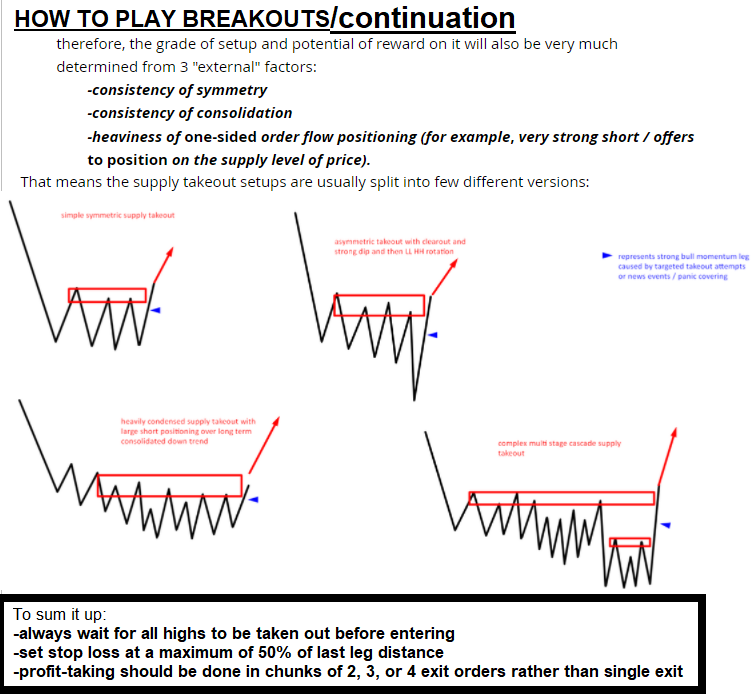
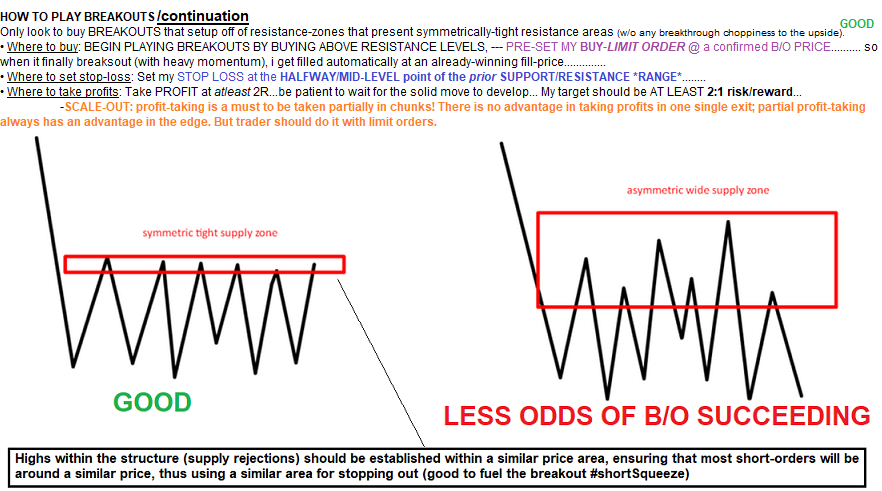
-SCALE-OUT: profit-taking is a must to be taken partially in chunks! There is no advantage in taking profits in one single exit; partial profit-taking always has an advantage in the edge. But trader should do it with limit orders.
- is the stock a former supernova? does it have a history of spikes and/or breakouts?
- how much did the stock's volume increase during it's past breakouts?
- what time of day was the breakout?
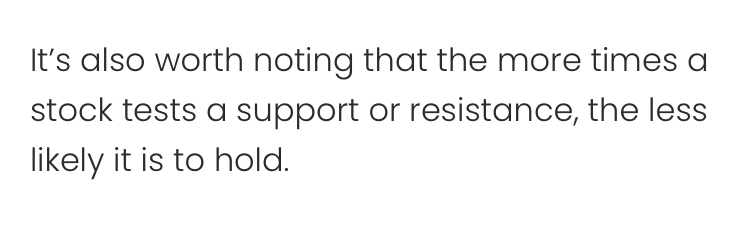
- how many times did the stock test PREVIOUS HIGHS before breaking out?
➜ buy above support; never chase a stock when it's passed it's breakout level..........
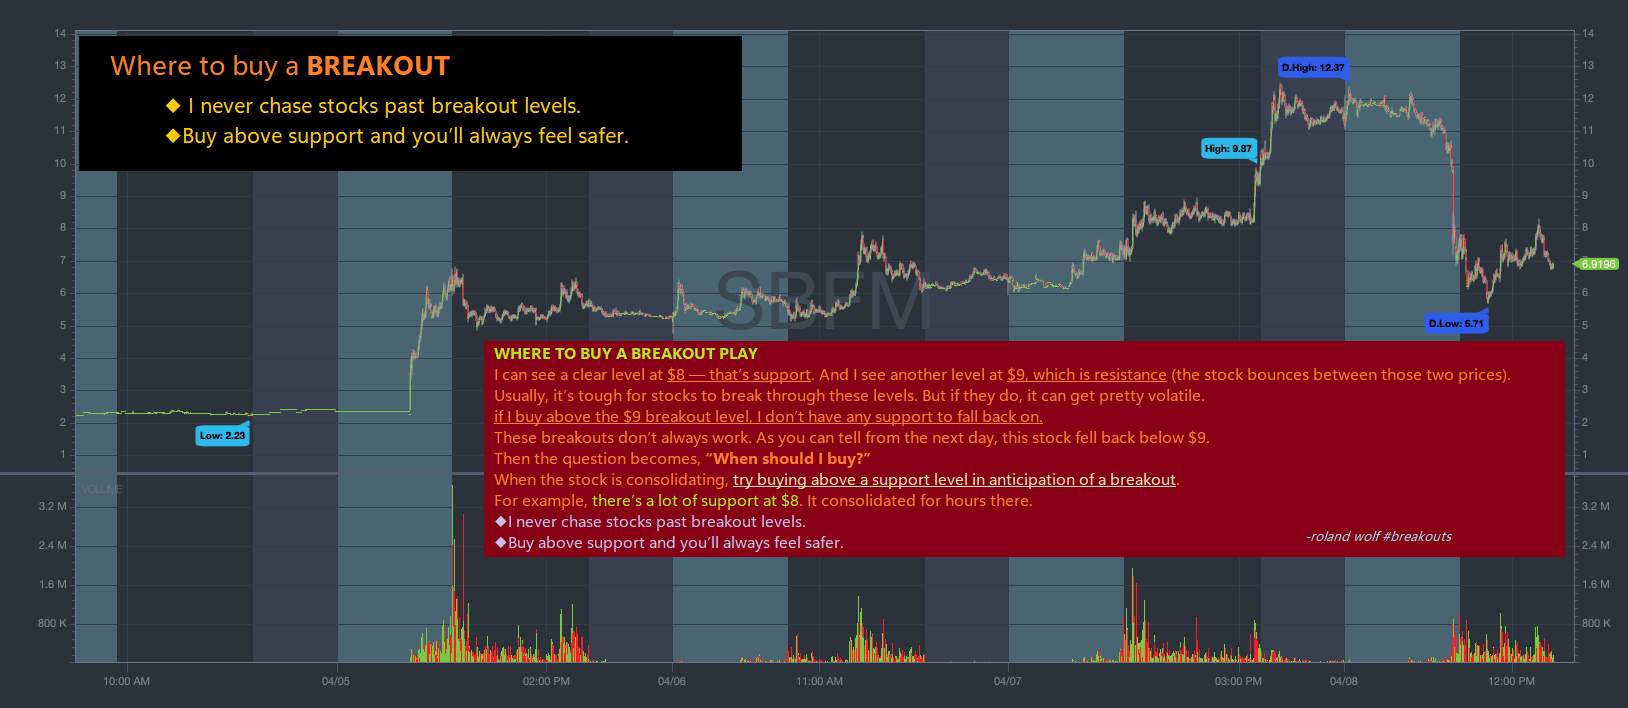
◆ I never chase stocks past breakout levels.
◆Buy above support and you’ll always feel safer.
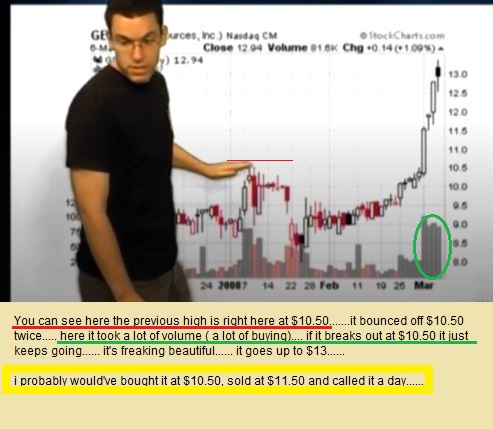
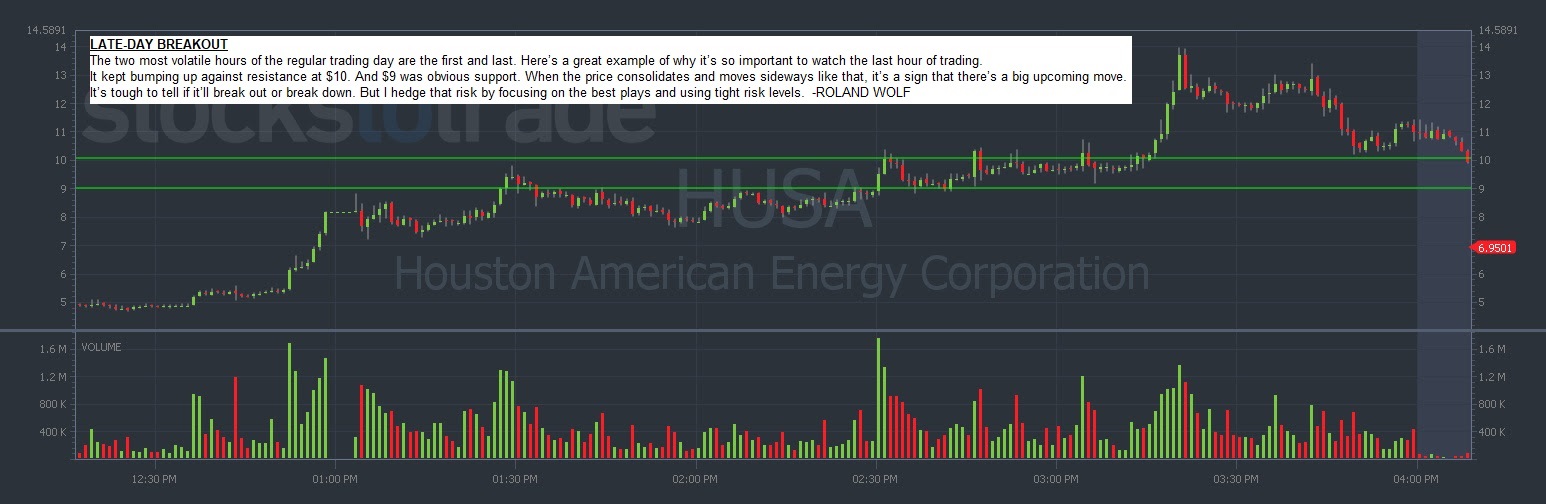
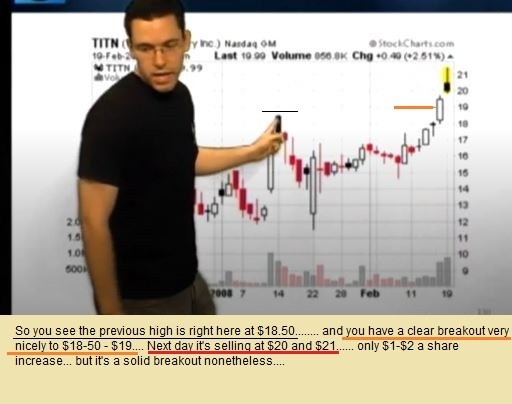
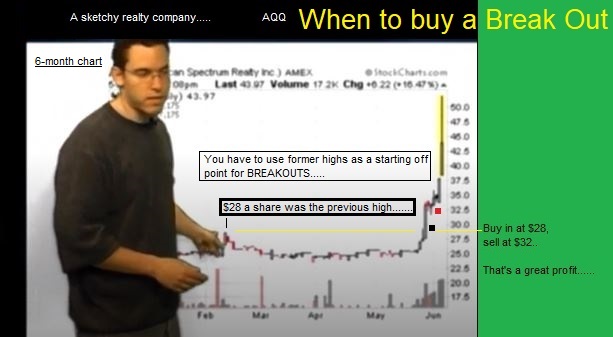
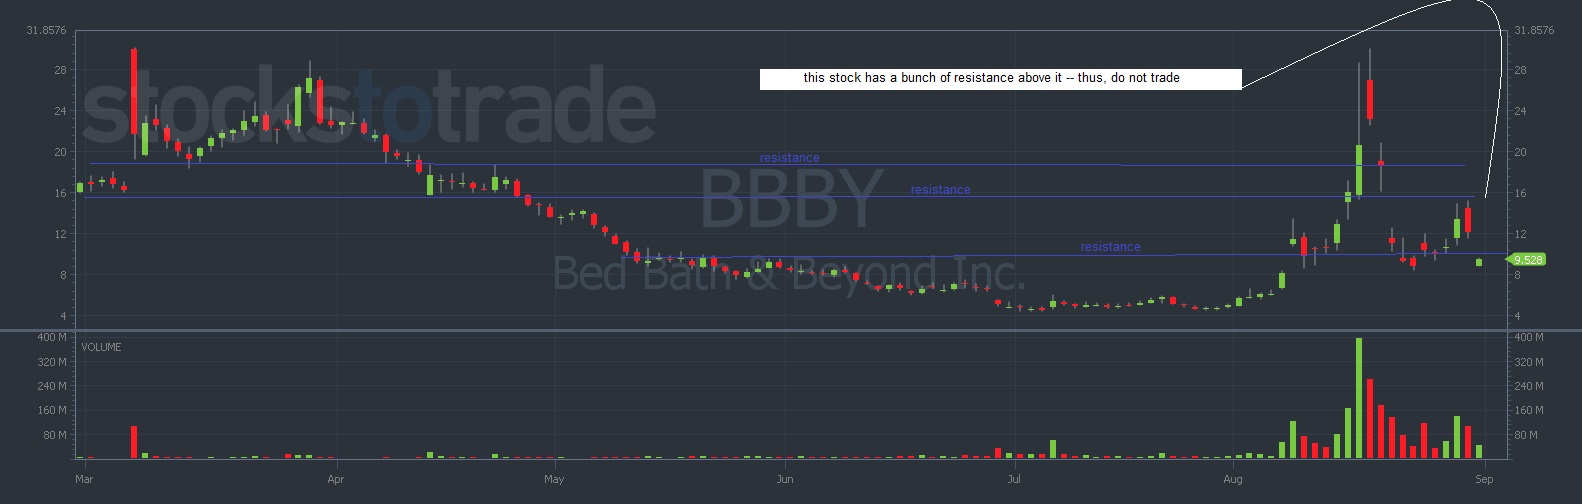
I can see a clear level at $8 — that’s support. And I see another level at $9, which is resistance (the stock bounces between those two prices).
if I buy above the $9 breakout level, I don’t have any support to fall back on.
When the stock is consolidating, try buying near a support level in anticipation of a breakout.
For example, there’s a lot of support at $8. It consolidated for hours there. Buy around $8 (at support) in anticipation of a breakout. -roland wolf #breakouts
Local highs and all-time highs are automatic lines of resistance. It’s difficult for stocks to reach new highs because…
- Shorts try to push them down
- And any bagholders sell into strength
So if it manages to break out, it’ll be on a lot of volume. And the move could go parabolic.
Traders looking to ride a breakout move will usually buy on dips above support. Then sit back and wait to see if it’ll go higher.
For both of these strategies::: cut the loss if it breaks through your support. Always trade with a plan.
When a stock goes on a massive run, everyone gets super excited about the news/hype around the company. Then the stock tanks. But instead of staying disciplined and cutting losses, bagholders hold. They either…
‣ believe in the company
‣ don’t want to be wrong
‣ are too stubborn to take a loss.
‣ or they’d rather hold out and wait until they’re breakeven.
I almost never like day-one moves on bag-holder stocks. There could still be a ton of selling pressure. And that means more supply than demand.
That’s why I prefer to wait. I want to see multiple green days in a row to confirm ongoing demand. That indicates a shift in supply and demand. Until then, it’s a guessing game.
If you had a winning trade, congrats. But don't get greedy. If you don’t take profits into strength, you could become another bagholder.
80% of the time, stocks die on day one.
It’s that other 20% I want to focus on.
Those are the stocks that give us the greatest potential for big winners.
Now, usually a stock needs a trending theme like Monekypox or electric vehicles to sustain a multi-week rally.
I see a lot of biotech companies soar on premarket news of this trial result or that drug approval.
These rarely hold up more than a few days.
But every once in a while, a special pattern develops. And if you can spot it, you might find the next explosive stock.
Keep a list of stocks that finish higher off their first big move. See whether they follow through the next day or spend the next week consolidating.
While there are plenty of setups for the follow through and day 3 tactics, there’s always a chance you find a stock biding its time for the big move. -Bohen #multiDayBreakouts
THE MINDSET OF TRADERS IN A STOCK THAT IS HITTING RESISTANCE ON THREE OCCASIONS OVER THE PAST 5 DAYS (Day 1, Day 3, Day 4)
There are likely three traders left in the stock:
1. those who bought in early, either haven’t taken profits or took some (and they'll want to sell into any spike before the weekend comes)
2. those who came late and bought somewhere after the run (they'll want to sell into any spike before the weekend comes)
3. short-sellers in the stock - there probably aren’t many of them left b/c the stock hitting resistance levels prior probably scared them to take profits in between (so short-squeeze odds are pretty slim)
* thus anyone buying into the stock (especially if it's on a Friday) is likely to get stuffed.
** Now, had shares pulled back some, that would give shorts a chance to accumulate and longs reset (a substantial pullback all the way back towards the low of the breakout candle is a positive factor).
GET A FEEL FOR THE STOCK'S MOVEMENT
Just like humans, stocks need time to recuperate.
Nothing goes up in a straight line.
You can think of the price action as energy. Each huge movement expends energy.
Naturally, they need time to rest.
Sometimes this can take a few days. Sometimes it can take a few weeks.
The reason I like multi-day runners over day one spikers is that they give you key levels to trade off. That makes it easier to plan your trades. You can base your entries and exits on key support and resistance levels on the chart. -Bohen


WHEN A STOCK RUNS 10 DAYS STRAIGHT (GREEN DAYS IN ROW), it's first red day is liable to result in more red days (lest a new catalyst appears and pushes it further).
Bottom line: The major gains have already been booked on the long side — and the shorts know this.
The experienced bulls likely sold into strength long ago and moved on, leaving the stock a prime target for short-sellers and put traders (options short-sellers).
When the psychology of the trade is at this stage — with desperation and panic beginning to noticeably set in — it’s time to be aggressive.
This can be a five-star setup with a high probability of success. And those don’t come around very often. -Croock #psychology
Which would you rather trade: A premarket squeezer on the 1st day or a multi-day runner?
My money’s always on the multi-day runner.
Why?
Because multi-day runners have something these fly-by-night stocks don’t … PROOF!
let me tell you a little secret … A stock can run for days but usually fails once!
That’s a big reason why I don’t like the sketchy biotechs that pop on news.
Instead, I prefer stocks that show me over a series of days, if not weeks, that they want to move higher.
Many traders struggle to find these stocks for two reasons:
- Multi-day runners have news that dropped before the current trading day
- Traders miss the trend reversal
Multi-Day runners criteria:
1. Is there heavy volume?
2. Is it in a hot sector?
3. Is it a former runner?
4. Is it a low-float stock?
4. Is there news?
It’s that last one that confuses folks.
You see, a multi-day runner doesn’t necessarily have news from that morning.
Most of the time, it’s news that dropped days to even weeks beforehand.
The press release can occur almost a week prior.
However, a multi-day runner takes news and builds momentum off the catalyst.
Volume remains steady as buyers keep pushing the stock higher day after day.
You see, a multi-day runner doesn’t necessarily have news from that morning. Most of the time, it’s news that dropped days to even weeks beforehand. However, a multi-day runner takes news and builds momentum off the catalyst. Volume remains steady as buyers keep pushing the stock higher day after day. -Bohen
HOW TO FIND MULTI-DAY RUNNERS
Once a stock's uptrend has been broken (i.e. once a stock dips/tanks), I want to see shares break back above the highs to prove to me the trend was still intact.
Because at the end of the day, if the trend isn’t clear, then I’m not interested.
Additional Tip…
Keep a watchlist of stocks from the past few months with multi-day runners.
Look for charts where shares continue to hold up above former breakout areas.
Then, watch for catalysts, news driven or otherwise, that can push the stock on its next leg higher. -Bohen
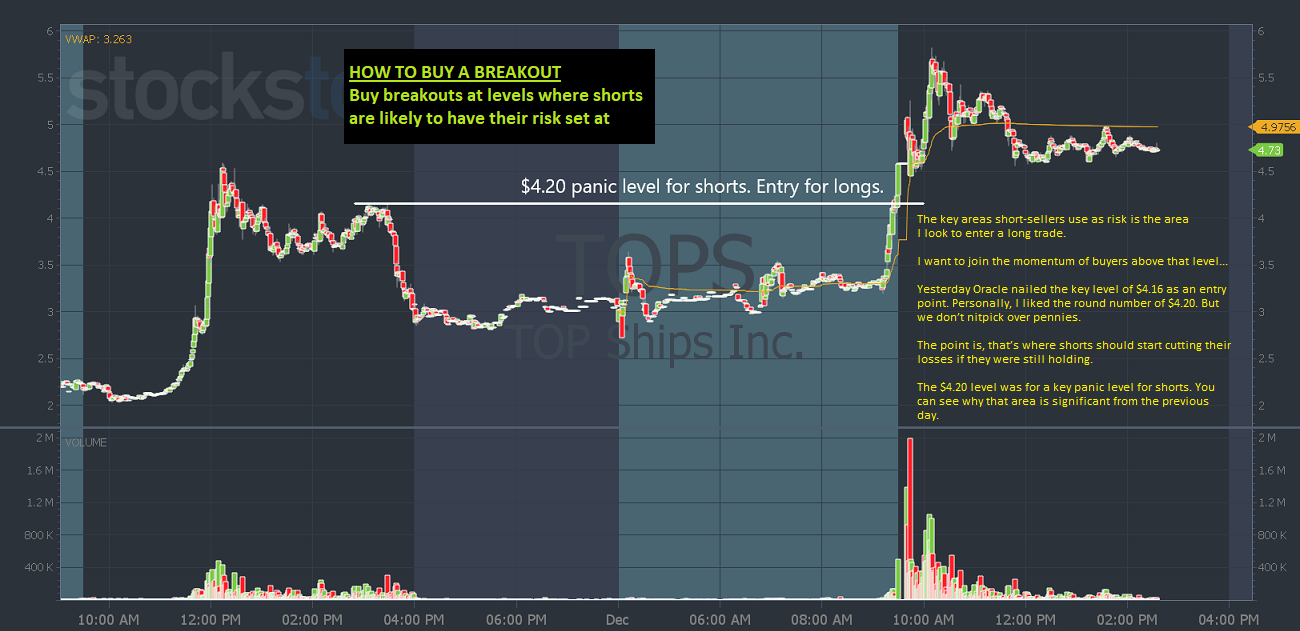
What we look for after the big first-day run is for the stock to open weak. It opens red and that makes shorts think it’s the first red day…
Short sellers think they’re in control…
But the dip is brief and the stock reverses and goes green. That’s typically the level shorts use as their risk. And the buying starts there with shorts buying to cover and longs entering to ride the momentum…
For this pattern, enter when the stock goes green. Then use VWAP or the low of the dip as your risk.
From there you can use Oracle support and resistance lines to guide your trade.
The great thing about the red-to-green move is that you can trade any time after the first green day. It’s great for multi-day runners and even day trading ‘real’ stocks that are uptrending. -Bohen

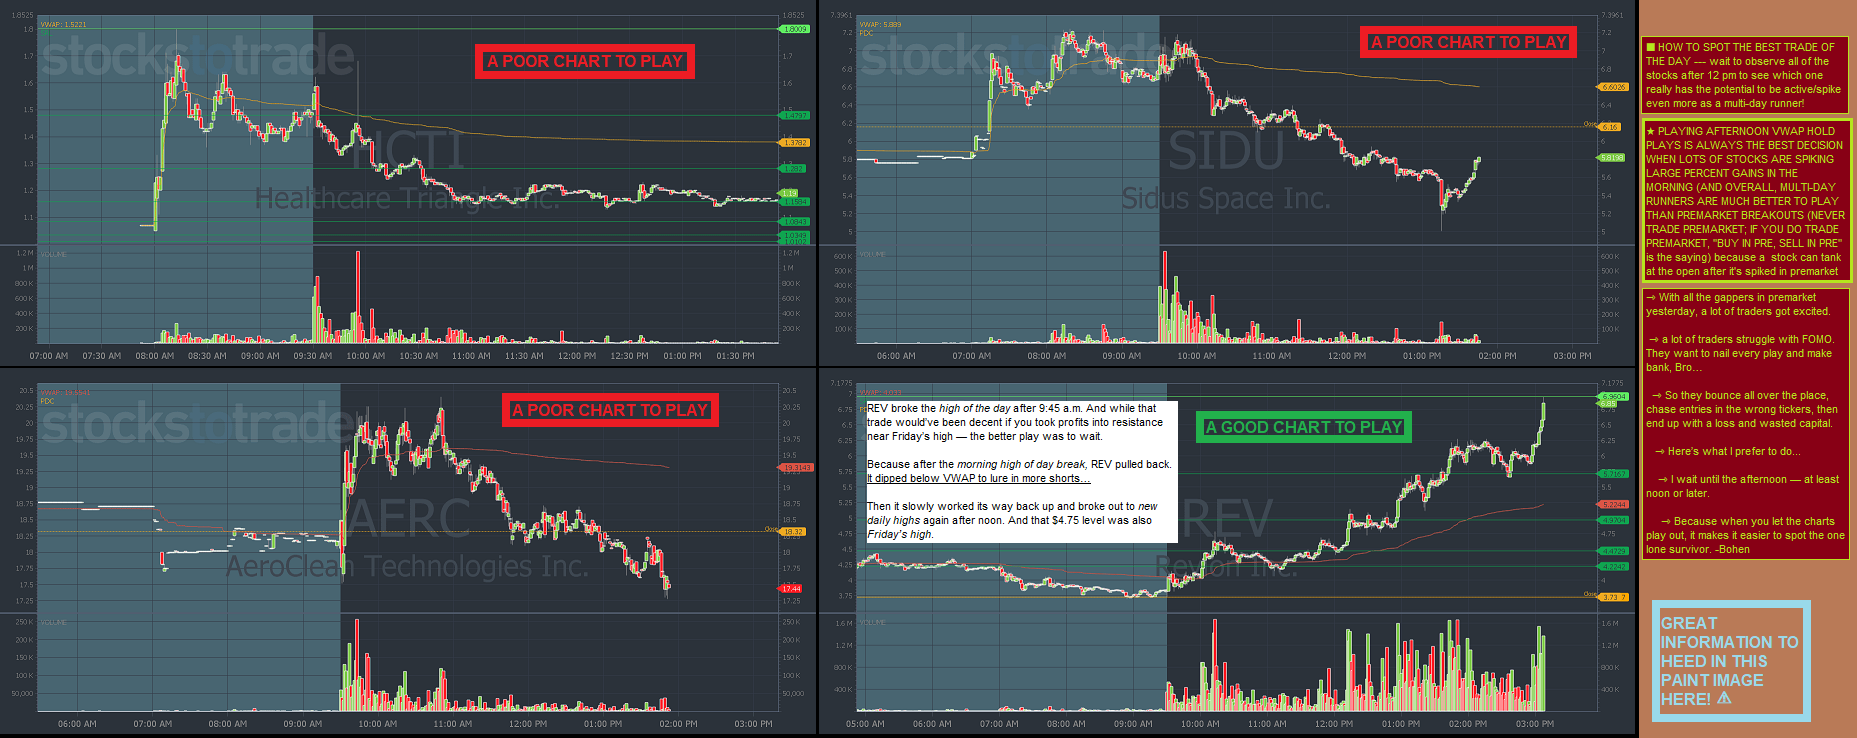
★ PLAYING AFTERNOON VWAP HOLD PLAYS IS ALWAYS THE BEST DECISION WHEN LOTS OF STOCKS ARE SPIKING LARGE PERCENT GAINS IN THE MORNING (AND OVERALL, MULTI-DAY RUNNERS ARE MUCH BETTER TO PLAY THAN PREMARKET BREAKOUTS (NEVER TRADE PREMARKET; IF YOU DO TRADE PREMARKET, "BUY IN PRE, SELL IN PRE" is the saying) because a stock can tank at the open after it's spiked in premarket
⇾ With all the gappers in premarket yesterday, a lot of traders got excited.
⇾ a lot of traders struggle with FOMO. They want to nail every play and make bank, Bro…
⇾ So they bounce all over the place, chase entries in the wrong tickers, then end up with a loss and wasted capital.
⇾ Here’s what I prefer to do...
⇾ I wait until the afternoon — at least noon or later.
⇾ Because when you let the charts play out, it makes it easier to spot the one lone survivor. -Bohen
So if all these biotechs eventually fail, what do I mean when I say the biotech sector is hot?
Well, I don’t mean you should buy biotechs with no news and no volume. And I certainly don’t mean buy morning Biotech runners and hold for multi-day runs…
That’s not how the biotech sector works.
When the biotech sector’s hot, watch for the next sketchy biotech stock with news.
Focus on day trade patterns only. When you see profits, take profits. -Bohen #biotechs #breakouts


you can buy a breakout above the previous high....also toward the end of the week, buying on a Friday==Friday's are very special where the hype can really build, short-sellers are scared to hold short during the weekend, so it gaps up over the weekend.......it really spikes, and it crashes in a 30 minute period on Monday ..that's volatility.... -Tim Sykes


• If a stock holds close to the high over a long period of time (3+ days), that weakens its hold (it is more likely to be OVER-EXTENDED and drop in price). <------good for SHORTS
• If a stock tanks (like many #biotechs on DAY 1), it will take a lot of buyers (volume) to break through resistance. <------heavy VOLUME is needed (for it to spike) if it's far from its HIGHS
So if all these biotechs eventually fail, what do I mean when I say the biotech sector is hot?
Well, I don’t mean you should buy biotechs with no news and no volume. And I certainly don’t mean buy morning Biotech runners and hold for multi-day runs…
That’s not how the biotech sector works.
When the biotech sector’s hot, watch for the next sketchy biotech stock with news.
Focus on day trade patterns only. When you see profits, take profits. -Bohen #biotechs #breakouts
These sketchy stocks run on news and hype around potential treatments for things like cancer, Parkinson's, and diseases you’ve probably never heard of.
Biotech news catalysts and hype can create great trading opportunities...
But there's a dark side to these stock market darlings.
◆Biotech stocks create great trade opportunities. Their news catalysts excite a lot of traders. But not all biotech news is created equal…
Some headlines can move stocks for multiple days. Other news may create spikes that quickly fail.
Why?
◆News about well-known diseases like cancer, Parkinson's, and Alzheimer's can create bigger moves. These diseases impact many people and have no cure. That strikes a nerve with people and triggers emotions…
Traders want to believe these companies will find a cure and save the day. They may also think the stock will be the next Moderna, Inc. (NASDAQ: MRNA). So they chase entries and hold.
◆But believing in these companies is the biggest mistake you can make with biotechs.
99.99% of biotechs fail.
◆Don’t hold biotech stocks long term or believe any of them will deliver on their promises.
Biotech stocks are day trades only.
Trade the news, momentum, and hype. Stick to your pattern and setup, then move on. And when a stock dies, it dies.
◆Don't bag-hold sketchy biotechs. -Bohen #biotechs