MIDDAY PERK----- this pattern happens rarely (thus is rarely successful). I perform poorly midday after 11:30 am, statistically speaking. eat or nap or hit gym or teach tennis during midday (use my time more productively than trading for scraps of rarified profit opportunity).
MIDDAY PERK
when a stock has a FIRST GREEN DAY (or a PREMARKET BREAKOUT) ---- that is a stock to eye for the MIDDAY PERK PATTERN to play out (between 11 am - 2 pm).
CRITERIA (for A+ setup of the pattern)
- has a MORNING SPIKE.
- comes back down mid-day (stays above it's OPEN price), consolidates for 1-2 hours with higher lows (holds half it's morning spike, at least; stays above its OPEN price).
- between 11 am - 2 pm: it starts cracking resistance again, for a spike.
- stock has a CLEAN chart (with clear support).
HOW THE MID-DAY PERK PATTERN PLAYS OUT
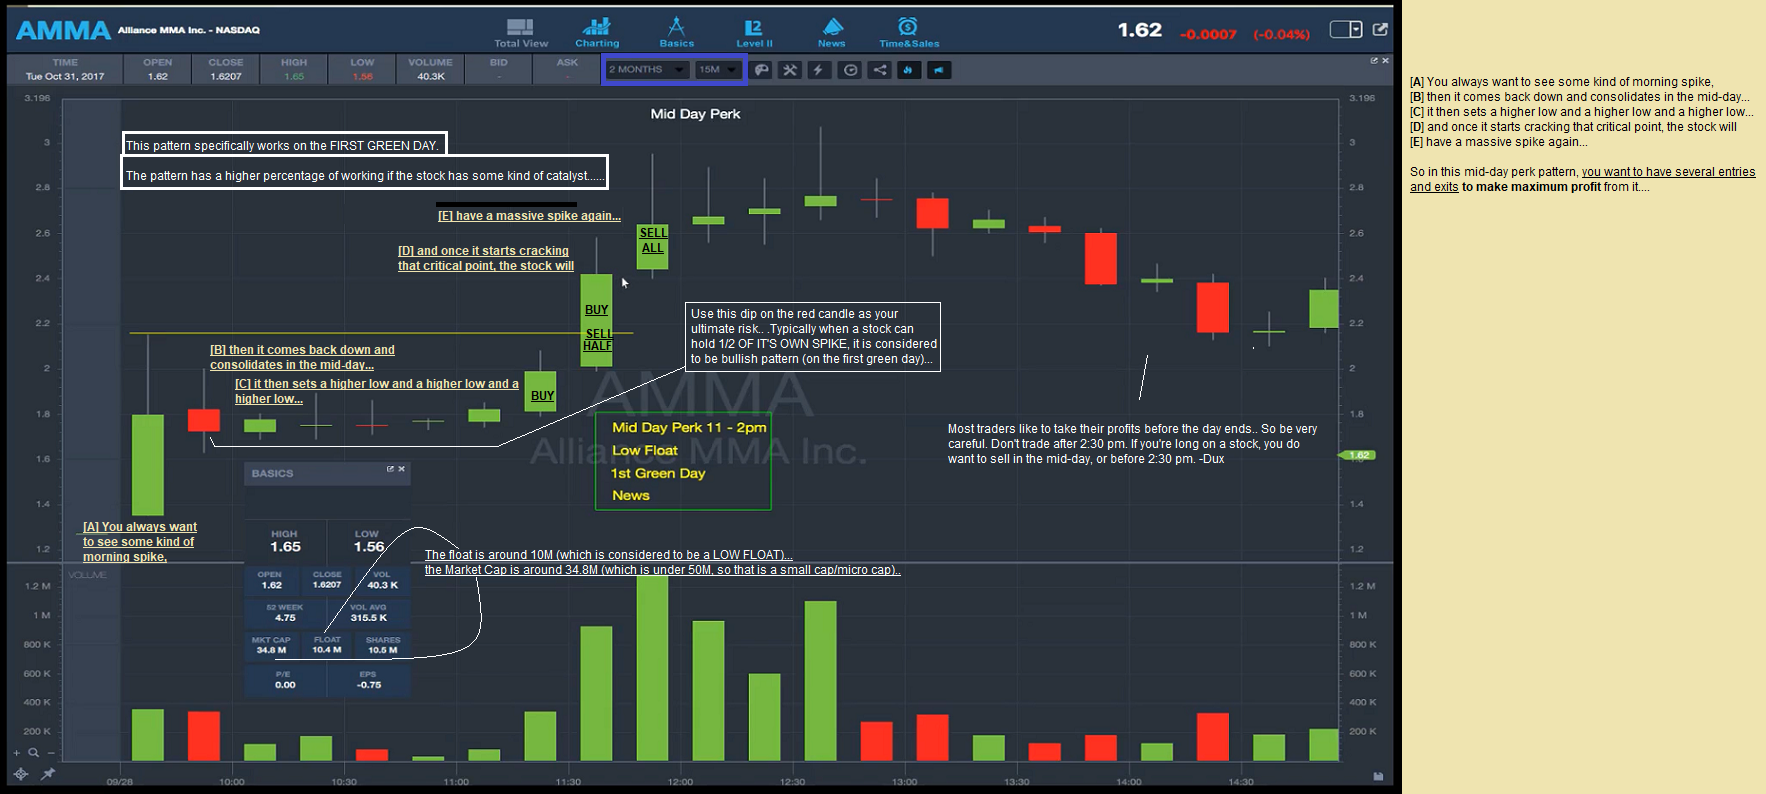
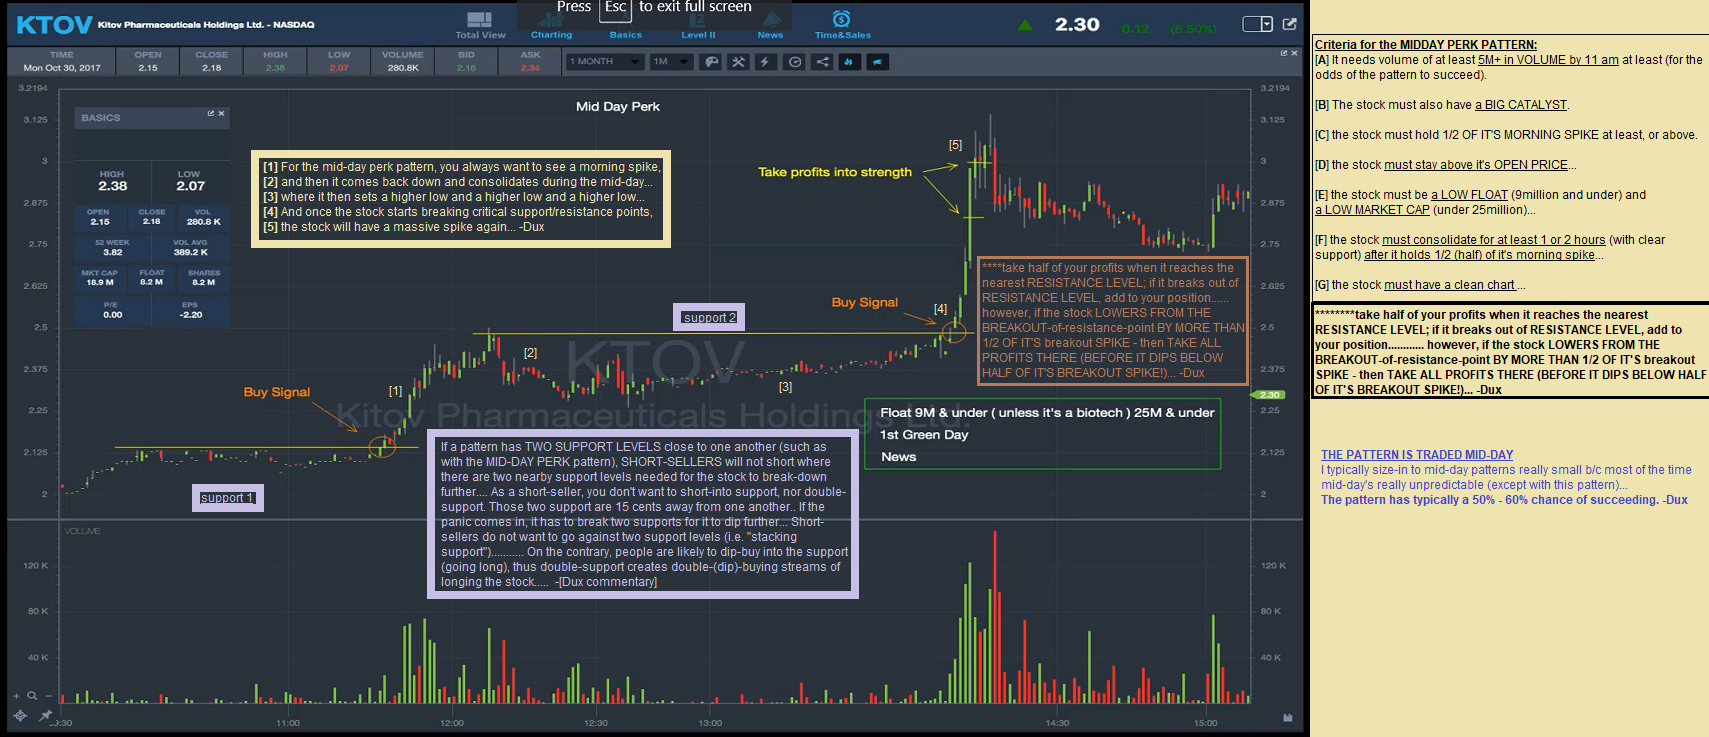
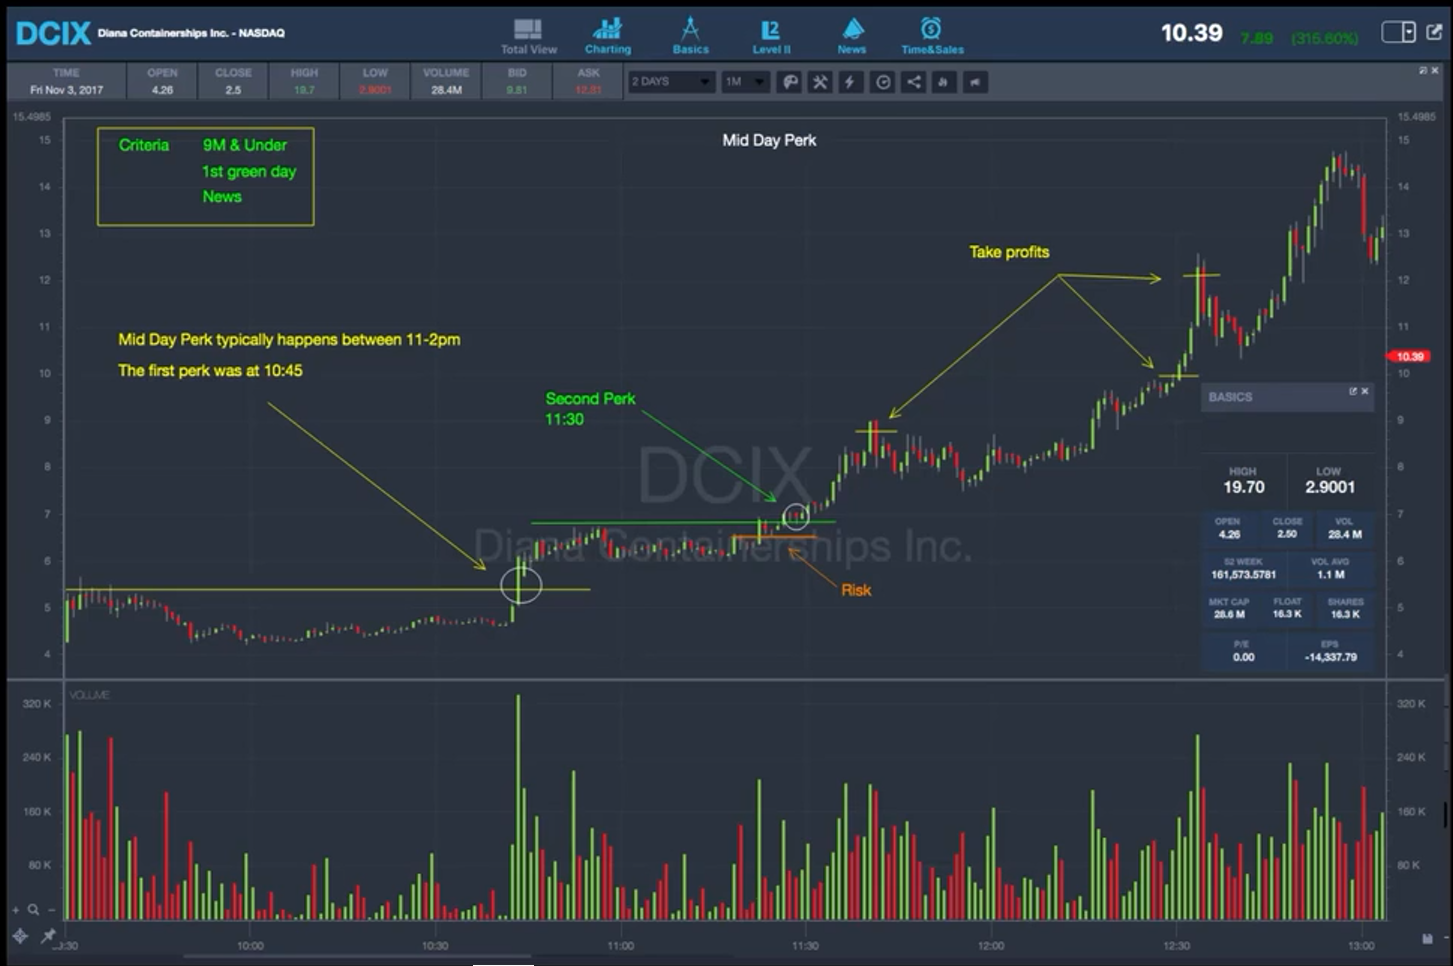
[1] For the mid-day perk pattern, you always want to see a morning spike,
[2] and then it comes back down and consolidates during the mid-day...
[3] where it then sets a higher low and a higher low and a higher low...
[4] And once the stock starts breaking critical support/resistance points,
[5] the stock will have a massive spike again... -Dux
_______________________________________________________
• size in really small b/c most of the time mid-day's really unpredictable.
• mid-day is typically a 50% - 60% chance of a pattern succeeding (less odds of working than the pre-market breakout pattern).
• take half your profits when it reaches the nearest RESISTANCE LEVEL;
• if it breaks RESISTANCE, add to your position....• however, if the stock LOWERS FROM THE BREAKOUT-of-resistance-point BY MORE THAN 1/2 OF IT'S breakout SPIKE - then TAKE ALL PROFITS THERE (BEFORE IT DIPS BELOW HALF OF IT'S BREAKOUT SPIKE!). -Dux
• in some mid-day perk patterns, you wanna have several entries and exits for max gains. -Dux
• a key is to buy the shares using the ASK button (not a limit order) when the stock is consolidating / perking --- Min 21: https://youtu.be/yZLA7zaTBPY ... #DanIrish
_______________________________________________________
______________________________________________________
REVIEW ALL THE CONTENT ON THIS SPREADSHEET TO HELP ME WITH TRACKING!
______________________________________________________
SCANNER (for finding the pattern)
A] has a MORNING SPIKE (is a FGD or Premarket B/O chart).
B] happens between 11 am - 2 pm.
C] at least 5+million VOLUME by 11 am (10m+ is great).
D] has good NEWS.
E] Float under 10 million
F] Market cap under 25 million
G] current price is above it's OPEN price
H] has double support levels nearby (short-sellers will not short into double support; this increases odds of rebounding).
Some tickers do not match the full criteria [of the pattern]... take smaller size where less criteria is matched).... -Dux
_______________________________________________________
Only track the STOCKS that successfully played the pattern out! this way i can look for the multiple similarities the "successful" stocks had with one another, and find consistencies in the probabilities behind a pattern's success.... Then create RULES to follow (based on the factors that the stock ought to possess (i.e. low float, etc.).
FOR ALL PATTERNS, I MUST:
1. track the average gain (the average gain possible across 100+ samples) --- tells me when best to take profits (so i don't get greedy; gives confidence in holding my position optimally).
2. track the top tick % (what is the avg top tick ($) across 100+ samples) --- tells me when it is best to enter the trade.
3. track the bottom tick % (what is the avg bottom tick ($) across 100+ samples) --- tells me when it is best to exit the trade.
I CAN ADD [SPIKEET] TO MY EXCEL SPREADSHEETS BY USING THE "SPIKEET PLUGIN" TO RETRIEVE STOCK MARKET DATA FOR ME -------- www.twitter.com/_spikeet/status/1567826513915006976?s=20 ......... https://bit.ly/3xB4seL ......... #SPIKEET #EXCEL
_____________________________
As a beginner trader, narrow your entire trading to one or two patterns so you can just FOCUS on those patterns... Then improve your entry and exit points to make this pattern PERFECT based on your performance... Experienced traders know where they're going to enter and exit. Beginner traders do not have enough data to back up their thesis. This is the major difference between experienced and beginner traders... -Dux
__________________________________________
How to track GAPPERS / %GAIN DAY 1 statistics (onwards) ------------ categorize my statistics based on Grittani's Trading Tickers 1 (PART 1) DVD --------- Min 3:55:00 ..........................
Min 18 ------ Min 57 ------- CHAPTER 3 ------- Trading Tickers 2 ----- tracking BREAKOUTS --------- members.timothysykes.com/lessons/trading-tickers-2-chapter-3 .........
TRACKING STATS ------ Min 51:20----Min 1:12:45 ----- PART 4 ---- TRADING TECHNIQUES ...
Track my average gain and losses on the pattern (both: what was actualized; what i could've actually made had i played it perfectly -- and find the avg. entry/exit points for both so I can learn when it is always best to buy and then sell).... sell into strength, and take my profits at the average gain price (average price coming from multiple examples, based on the criteria matched for the pattern)... -Dux recommendation
include these in my stats to track
is the stock a former supernova? does it have a history of spikes and/or breakouts?
how much did the stock's volume increase during it's past breakouts?
what time of day was the breakout?
how many times did the stock test PREVIOUS HIGHS before breaking out?
A midday perk has been a recent pattern.
how are stocks that are spiking up with news around noon spiking?
Are they spiking an average of 10% or 15%, or lately, is it up 50% or 70%?
what is the stock's sector? industry?
What’s the volume?
What’s the market cap?
You start getting sweet spots in terms of volume, market cap, time of day.
It might sound overwhelming and complicated in the beginning, but this is not rocket science. There’s not more than maybe two dozen different strategies even possible with penny stock trading. And you can really narrow it down to two or three strategies working at any one time, max.
DATA-DRIVEN PATTERN STATISTICS
Within the past 15 days (if it's a very hot market) [or if it's a slower market, then the last 100+ days], find statistics on the strategy for:
~ what percentage did the pattern work (turn profitable)? (i.e. the pattern works 82% of the time)
~ what was the average profit rate percentage return of the pattern? (i.e. the pattern gives a return rate of 15% gains)
~ what was the average risk rate percentage return of the pattern? (i.e. the pattern gives an average risk rate of 5%)
~ what is the frequency of the pattern occurring? (i.e. the pattern over the past 10 days "in this hot market" has been working every single day, multiple times)
* then from the data, i can determine what my risk/reward for the setup would be (5% of 15% = 3:1 risk/reward), with 82% profitability, and it's happening every single day multiple times.
~~~running data benefits you a lot in seeing what works and what doesn't work, how often it works.............
REVIEW MY PART 4 STATISTICS NOTES I TOOK ON TRADING TECHNIQUES (DUX's DVD)! --- PART 4 (STATISTICS) -------- http://qintarcapital.com/trading-techniques.php ........
The Mid-day perk pattern works around 65% of the time. -Dux
SEE IMAGE BELOW TO TRACK STATS ACCORDINGLY:
Dux said the pattern only happened/happens about three times in 7 months (thus, it's just not worth even mentioning it).
I like stocks that break the morning high, in the afternoon... I don't like mid-day breakouts because most times they fail..... -Sykes
Trading mid-day has lower odds of success....... All of my trading is geared toward the market open and the market close...Between 11am and 1pm, almost every mid-day, i take off..... If you really want to structure your day, trade the first hour of the day and the last hour of the day. -Sykes
I ALREADY WATCHED EVERYTHING BELOW!
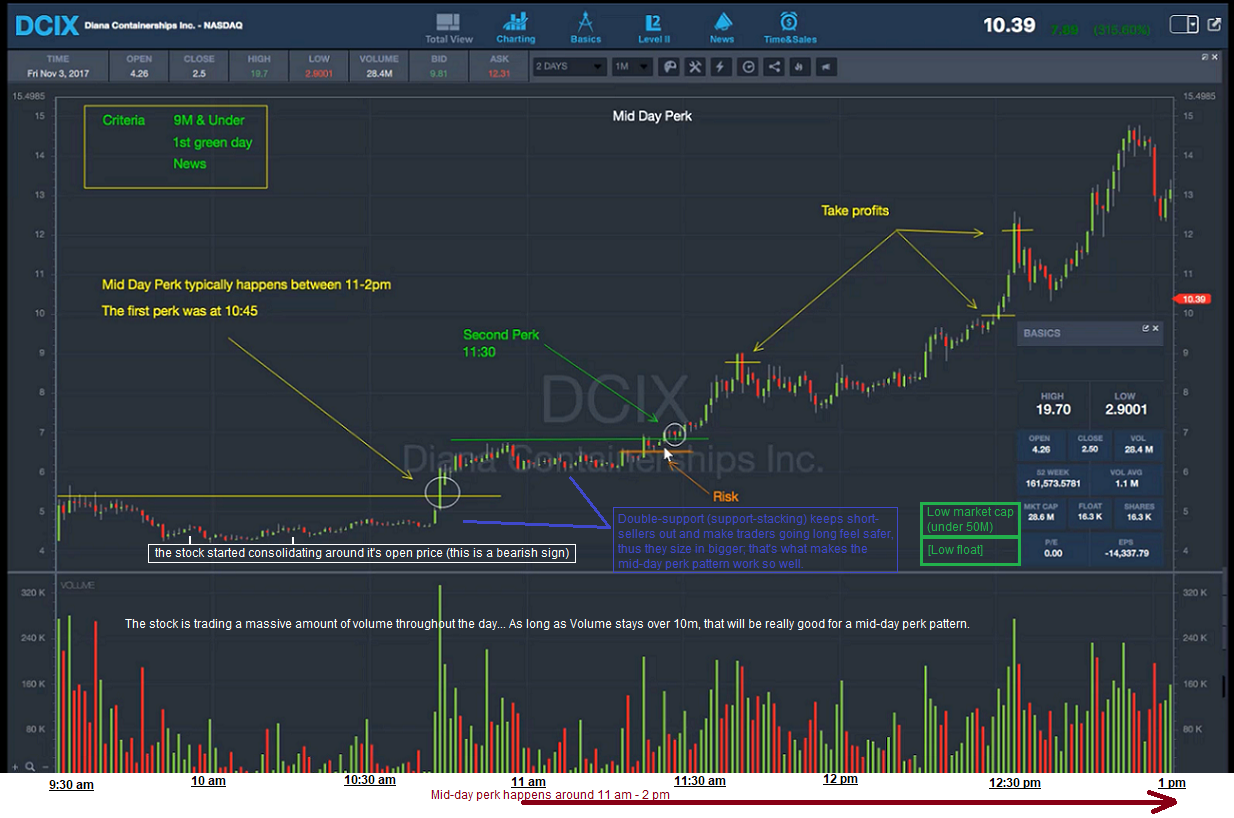
If a pattern has
TWO SUPPORT LEVELS close to one another (such as with the MID-DAY PERK
pattern), SHORT-SELLERS will not short where there are two nearby support
levels needed for the stock to break-down further.... As a short-seller, you
don't want to short-into support, nor double-support. (Ex. those two support are 15 cents away
from one another.. If the panic comes in, it has to break two supports for it
to dip further)... Short-sellers
do not want to go against two support levels (i.e. "stacking
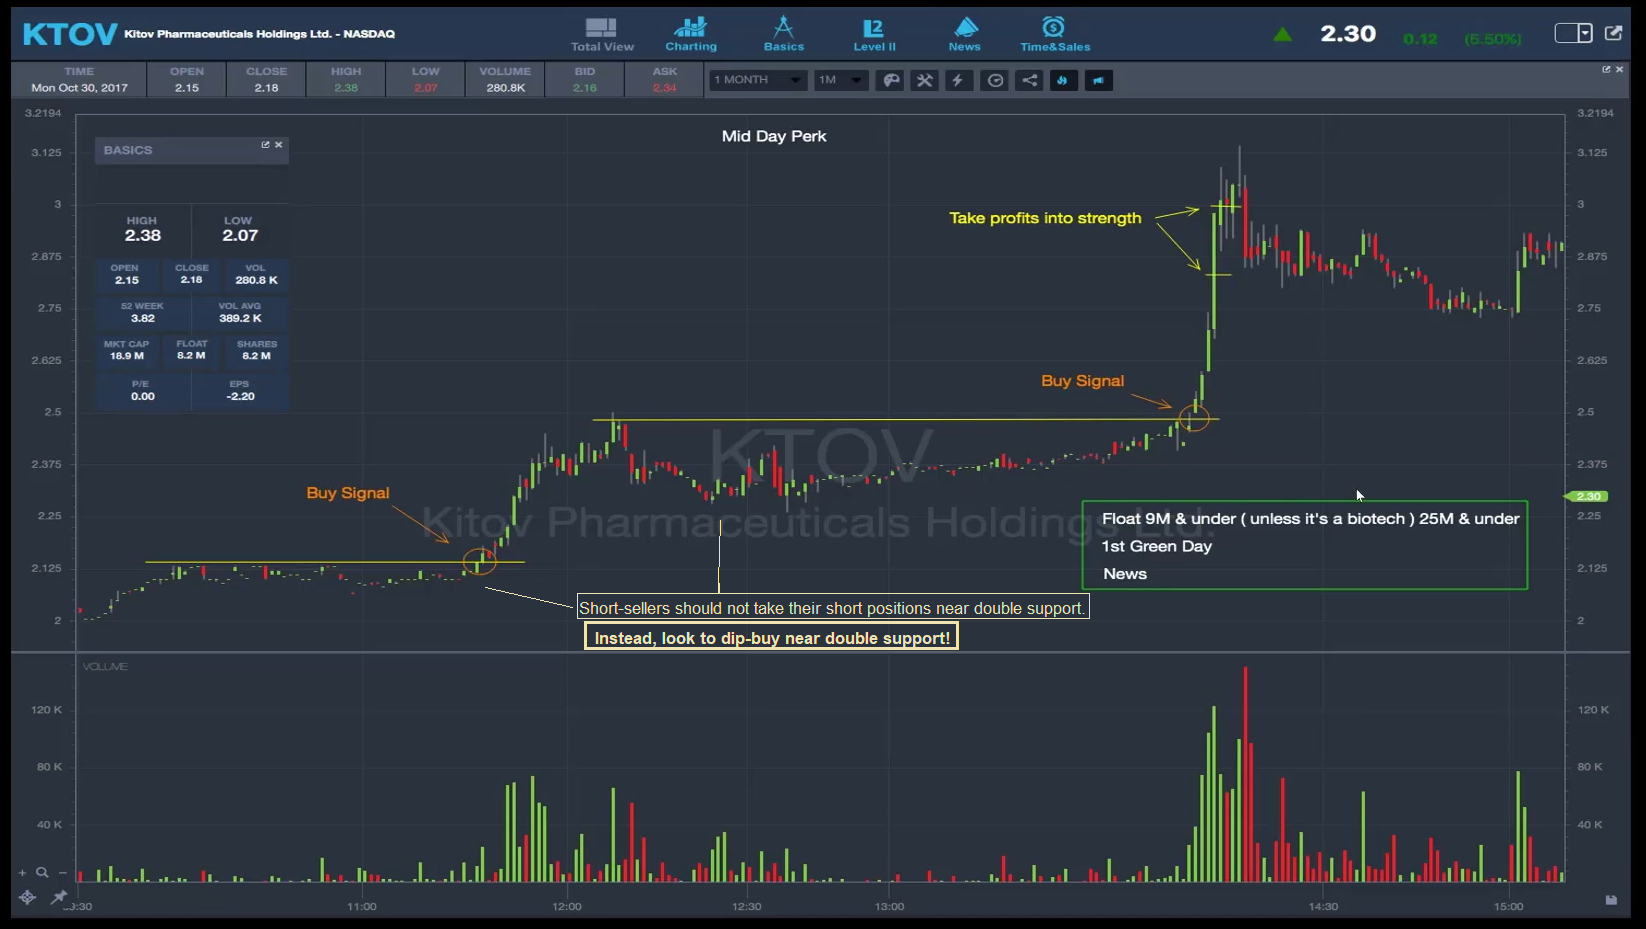
support")........... on the contrary, people are likely to dip-buy into
the support (going long), thus double-support creates double-(dip)-buying
streams of longing the stock..... -[Dux commentary]
This pattern is traded midday.. Typically I size in to mid-day patterns really small b/c most of the time mid-day's really unpredictable (except only with this one pattern)... The mid-day perk pattern has less odds of working (than the pre-market breakout pattern) because mid-day is typically a 50% - 60% chance of a pattern succeeding. The Mid-day perk pattern works around 65% of the time. -Dux
Min
21 -------- A key is to buy the shares using the ASK button (not a limit order)
when the stock is in consolidation / perking
------ www.youtube.com/watch?v=yZLA7zaTBPY ....... #DanIrish
__________________________________________________________________________________________________________________________________________________
MONACO: What’s the
best way to stay on top of which strategies are working? Strategies evolve, so
how do you know if it’s working now versus next week?
SYKES: People use
spreadsheets, online calculators, note cards, social media. Again, you could do
whatever you want, but write everything down. Don’t keep it in your head. And
don’t be like, “Oh, I think I like this strategy. Oh, I think this one feels
good.” No, it’s data.
I know Tim Grittani, for
example, keeps detailed spreadsheets. How did morning dip buys do over the past
seven morning dip buys of stocks that dropped 20% or more? How much do they
bounce? He tracks it. Even if he doesn’t trade the stocks.
A midday perk has been a
recent pattern. So, how are stocks that are spiking up with news around noon
spiking? Are they spiking an average of 10% or 15%, or lately, is it up 50% or
70%?
What’s the volume?
What’s the market cap? You start getting sweet spots in terms of volume, market
cap, time of day, different patterns. And you can see stuff go in and
out.
It might sound
overwhelming and complicated in the beginning, but this is not rocket science.
There’s not more than maybe two dozen different strategies even possible with
penny stock trading. And you can really narrow it down to two or three
strategies working at any one time, max.
-
MONACO: And that
data, it tells you what’s going on, but it also gives you another layer of
confidence. Because you know the odds. Say the midday perk pattern is going to
work 70% of the time. That’s an edge right there, and it helps your trading.
SYKES: And that’s
how you judge it. When Tim Grittani says he cuts losses intelligently, he tries
to give these patterns time.
If you have statistics
that show a pattern with this volume, with this sector over the past month,
that’s been working 90% of the time … You want to give that pattern the time to
play out. Because nine times out of 10, at least lately, it’s done well.
Obviously, industry
rules and legal advice says past performance is not indicative of future
returns. Anything can happen at any time.
But we’re in this
industry full of statistics and probability. And if you’re determining the
difference between two trades and you have data on each of the two patterns …
Say one pattern works 50% of the time, one pattern works 90% of the time …
Obviously anything can happen, but I’m going to have more confidence in the
pattern that’s been working 90% of the time lately.
__________________________________________________________________________________________________________________________________________________
Trading mid-day has
lower odds of success....... All of my trading is geared toward the market open
and the market close...... -Sykes ........ #PLAYS
Between 11am and 1pm,
almost every mid-day, i take off..... If you really want to structure your day,
trade the first hour of the day and the last hour of the day..... -Tim
Sykes ....... #PLAYS
Min :30 seconds ---------- Min 3:15 ----------- Min 6:20 ----------- Min 7:15!!!!!!!!!!!!!! [after 10:30 am, GO LONG (do not Short-sell!)] -------------- money flow concept; go long on hot stocks, short-sell the stocks that have exhausted (and traders have moved away from (and toward another stock)) -------- https://youtu.be/Bf0mS8CC9ew .......... #flow #moneyFlow
Min 22:55 --------- HOW TO MANAGE MY TRADE (I.E. RAISE MY STOP LOSS HIGHER IF THE TAPE IS HOLDING A LEVEL HIGHER THAN WHAT I WAS CURRENTLY RISKING; RAISING MY STOP LOSS MEANS I CAN BUY ADDITIONAL SHARES, THUS LOWERING MY AVERAGE ENTRY PRICE, WHILE MAINTAINING GOOD RISK MANAGEMENT!) --------- manage my trades by raising my RISK LEVEL potentially (raising my STOP LOSS), which would then enable me to add more shares to my current open position, based on the SHARES I TOOK with my risk initially being lower, serving as a fraction of the TOTAL POSITION SIZE I AM ABLE TO ACTUALLY TAKE were i to raise my risk/stop loss level! ------- Trading Tickers 2 – Chapter 7 -------- https://members.timothysykes.com/lessons/trading-tickers-2-chapter-7 .........
lookup MIDDAY PERK keywords here ------------ http://qintarcapital.com/trading-techniques.php ............
The midday perk pattern typically happens between 11 am - 2 pm.
MID-DAY PERK PATTERN happens between 11 am - 2 pm ---- starts at Min 53:55 in "Part 2" of Trading Techniques DVD.... Min 59 of "Part 2 ORIGINAL" vid... TRACKING STATS: dux doesn't provide statistical tracking for the MID DAY PERK because Dux said the pattern only happened/happens about three times in 7 months (thus, it's just not worth even mentioning it).
IF I CHOOSE TO TRACK THIS PATTERN, THEN I MUST REVIEW MY PENNYGRIND NOTES ON DUX'S TRADING TECHNIQUES DVD, AND GRITTANI'S TRADING TICKERS 1 AND TRADING TICKERS 2 DVDs notes ------ THESE 3 DVDs TRULY TELL ME HOW TO SUCCEED IN TRACKING AND PLAYING THIS SETUP
LOOK AT MY "NEWEST NOTES" WEBPAGE, AND ALL OTHER WEBPAGES (USING CTRL-F TO HELP ME LOCATE KNOWLEDGE ON THIS PATTERN!)
REVIEW MY PART 4 STATISTICS NOTES I TOOK ON TRADING TECHNIQUES (DUX's DVD)! --- PART 4 (STATISTICS) -------- http://qintarcapital.com/trading-techniques.php
IF I DECIDE TO TRACK THIS PATTERN: CTRL-F the pattern name throughout all of my webpages/notes.... and copy and paste such referential notes (for each pattern) into this respective spreadsheet accordingly [(this way I'm organizing the knowledge)]......Review the notes collected, & figure out what to look for to successfully begin tracking, trading, and succeeding....
In the middle of the day you get choppiness, you don't get big breakouts.. every now and then it happens but not for the most part. -Tim Sykes
Track my average gain and avg losses on the pattern (both: what was actualized; what i could've actually made had i played it perfectly -- and find the avg. entry/exit points for both so i can learn when it is always best to buy and then sell).... sell into strength, and take my profits at the average gain price (average price coming from multiple examples, based on the criteria matched for the pattern)... -Dux recommendation
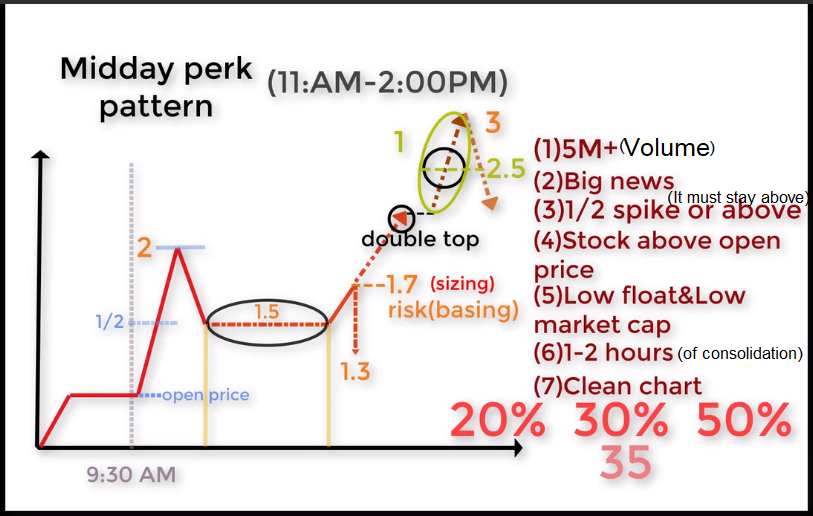
Criteria for the MIDDAY PERK PATTERN:
[1] It needs volume of at least 5M+ in VOLUME by 11 am at least (for the odds of the pattern to succeed).
[2] The stock must also have a BIG CATALYST.
[3] the stock must hold 1/2 OF IT'S MORNING SPIKE at least, or above.
[4] the stock must stay above it's OPEN PRICE...
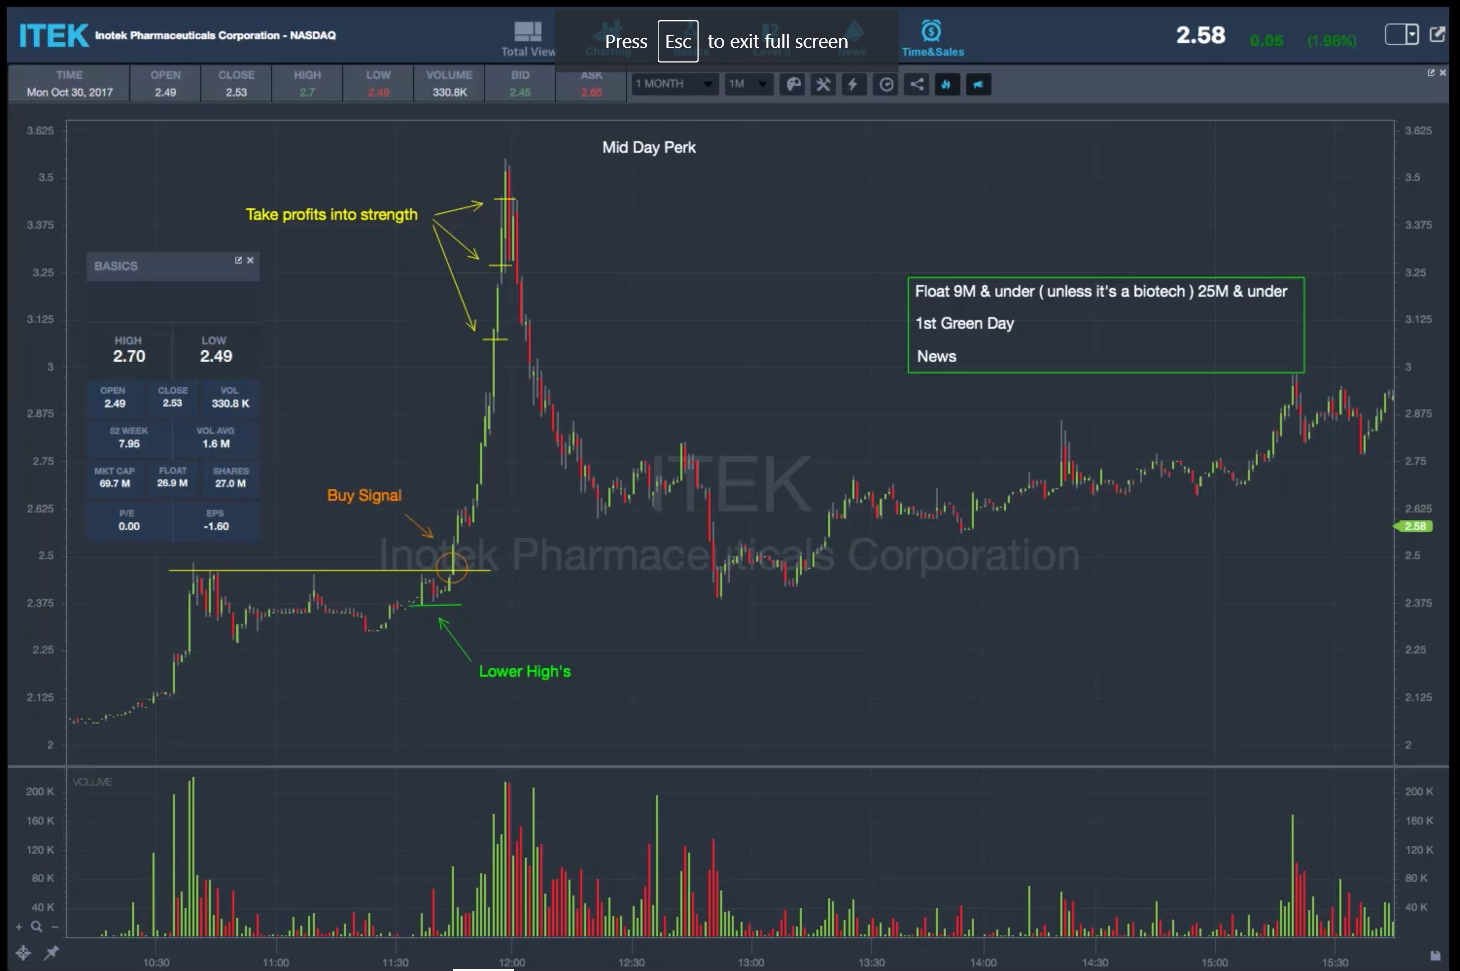
[5] the stock must be a LOW FLOAT (9million and under) and a LOW MARKET CAP (under 25million)...
[6] the stock must consolidate for 1 or 2 hrs (with clear support and lower highs formed) after it holds 1/2 (half) of it's morning spike...
[7] the stock must have a clean chart ...
********take half of your profits when it reaches the nearest RESISTANCE LEVEL; if it breaks out of RESISTANCE LEVEL, add to your position............ however, if the stock LOWERS FROM THE BREAKOUT-of-resistance-point BY MORE THAN 1/2 OF IT'S breakout SPIKE - then TAKE ALL PROFITS THERE (BEFORE IT DIPS BELOW HALF OF IT'S BREAKOUT SPIKE!)... -Dux
Some tickers do not match the full criteria [of the pattern].... For tickers that do not, you have to manage your position size (take smaller size where less criteria is matched).... -[Dux commentary]
HOW THE MID-DAY PERK PATTERN PLAYS OUT
[1] For the mid-day perk pattern, you always want to see a morning spike,
[2] and then it comes back down and consolidates during the mid-day...
[3] where it then sets a higher low and a higher low and a higher low...
[4] And once the stock starts breaking critical support/resistance points,
[5] the stock will have a massive spike again... -Dux
Dux said the pattern only happened/happens about three times in 7 months (thus, it's just not worth even mentioning it).
a LOW FLOAT and a LOW MARKET CAP are always needed if you're going long because that will increase your winning percentage. -Dux
When the MARKET CAP and the FLOAT are both high, that decreases the stock's winning percentage. -Dux
If a BIO TECH stock has a low float and a low market cap, that's even better for buyers... -Dux
Learn to take profits circa 2:30 pm or so, since most day traders do not like to hold overnight (and eventually will sell mid to late day), be sure to take profits prior to the wave of sellers selling their shares (and the ticker price dropping). Most traders like to take their profits before the day ends.. So be very careful. Don't trade after 2:30 pm.... If you're long on a stock, you want to sell in mid-day, or before 2:30 pm. -Dux
In some mid-day perk patterns, you want to have several entries and several exits to make maximum profit from it. -Dux
I like stocks that break the morning high, in the afternoon... I don't like mid-day breakouts because most times they fail..... -Sykes
include these in my stats to track
is the stock a former supernova? does it have a history of spikes and/or breakouts?
how much did the stock's volume increase during it's past breakouts?
what time of day was the breakout?
how many times did the stock test PREVIOUS HIGHS before breaking out?