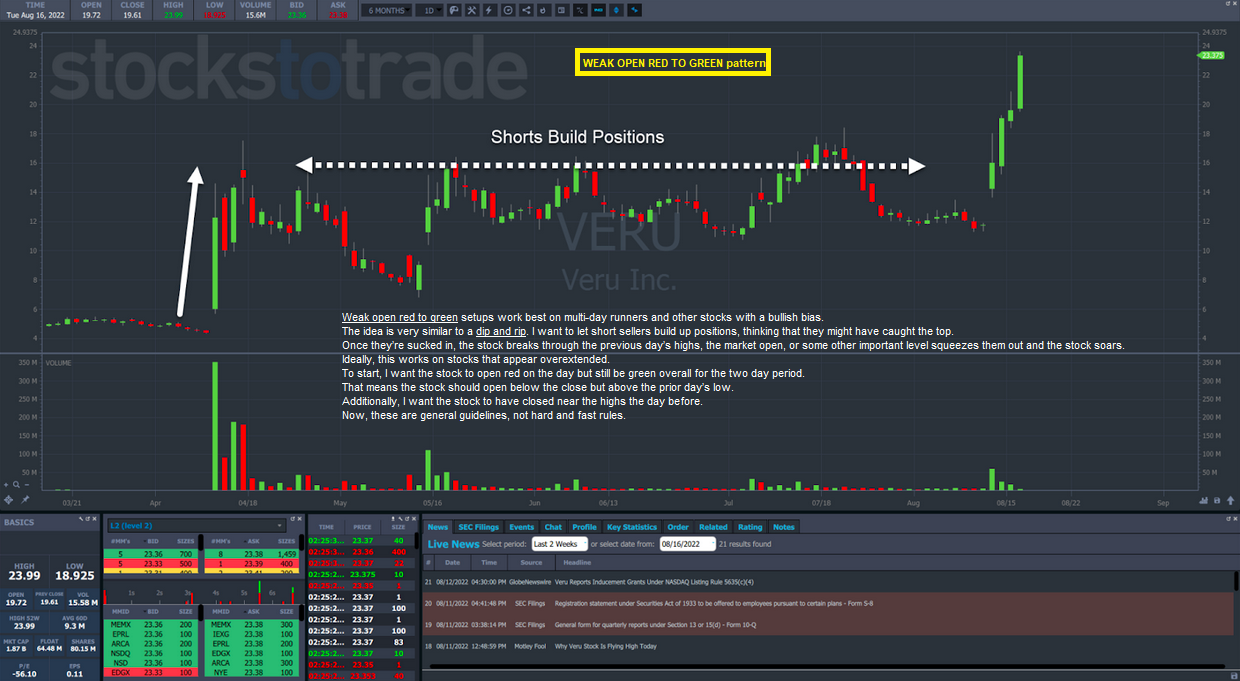
FACTORS TO LOOK FOR WHEN TRADING THE [WEAK OPEN RED TO GREEN PATTERN]
- hot sector
- It’s heavily shorted
- Multi-day runner
- Closed at or around the high of the day (on its prior day)
- Good Volume -Bohen
When I’m looking for stocks, I focus on a few factors:
• Listed stocks below $5
• Spiking at least 20%
• Low volume (below 10 million shares)
• High trading volume (at least 1 million shares)
• Credible news
If a stock like this shows up on the scan, I add it to my watchlist. -Mark Croock
FIRST GREEN DAY
Up a ton early on with chat pumps, heavy volume, news … the works.
These are the kinds of stocks I follow throughout the day to find potential setups whether it’s after 9:45 a.m. or 2:15 p.m.
They don’t always provide setups, but if you follow enough of them, one will sooner or later. -Bohen
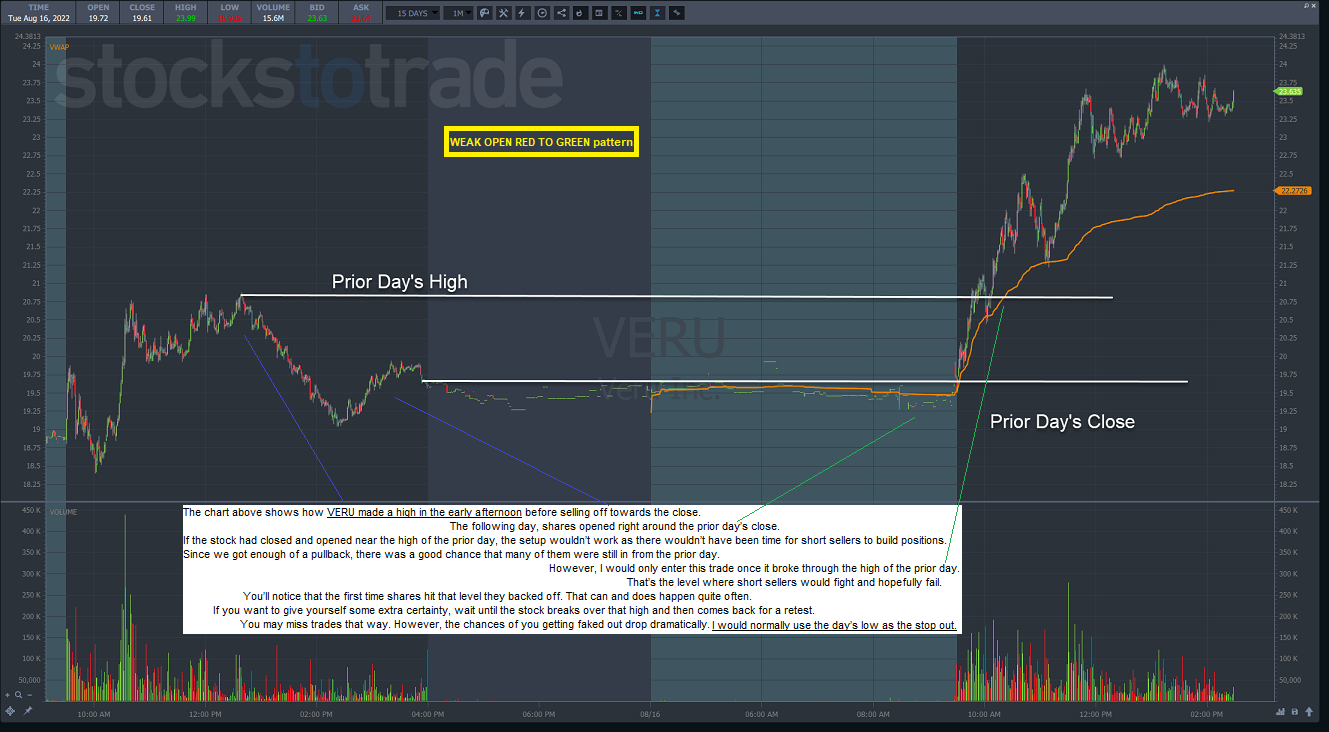
Most of my patterns use key psychological levels as entry points...
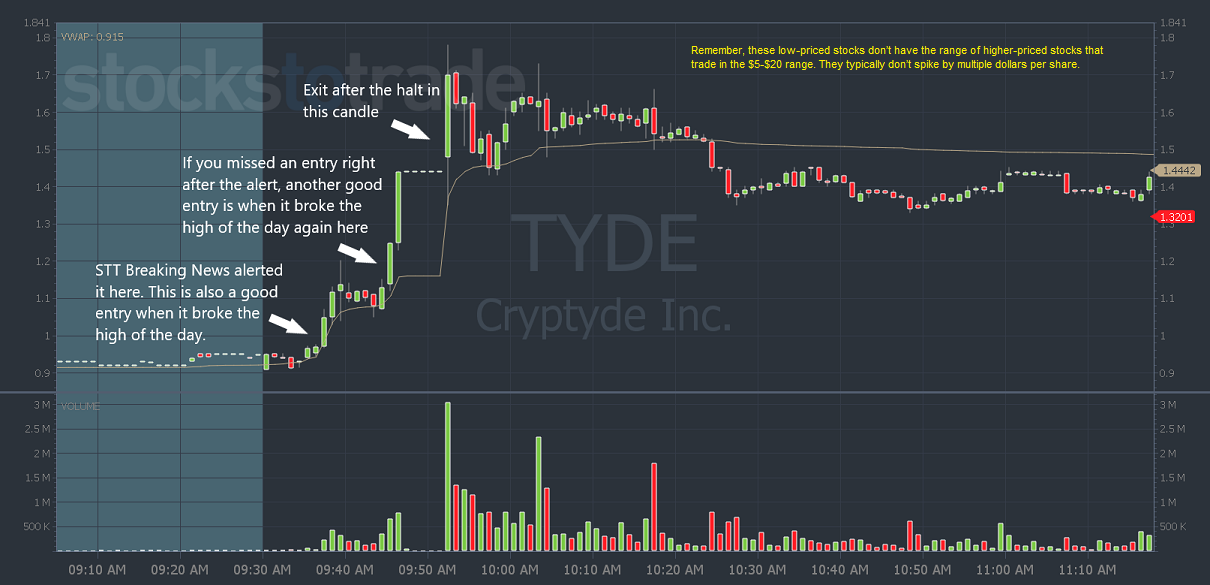
• The DIP AND RIP key entry is a break above the high of the day. That’s where short sellers typically set their risk levels.
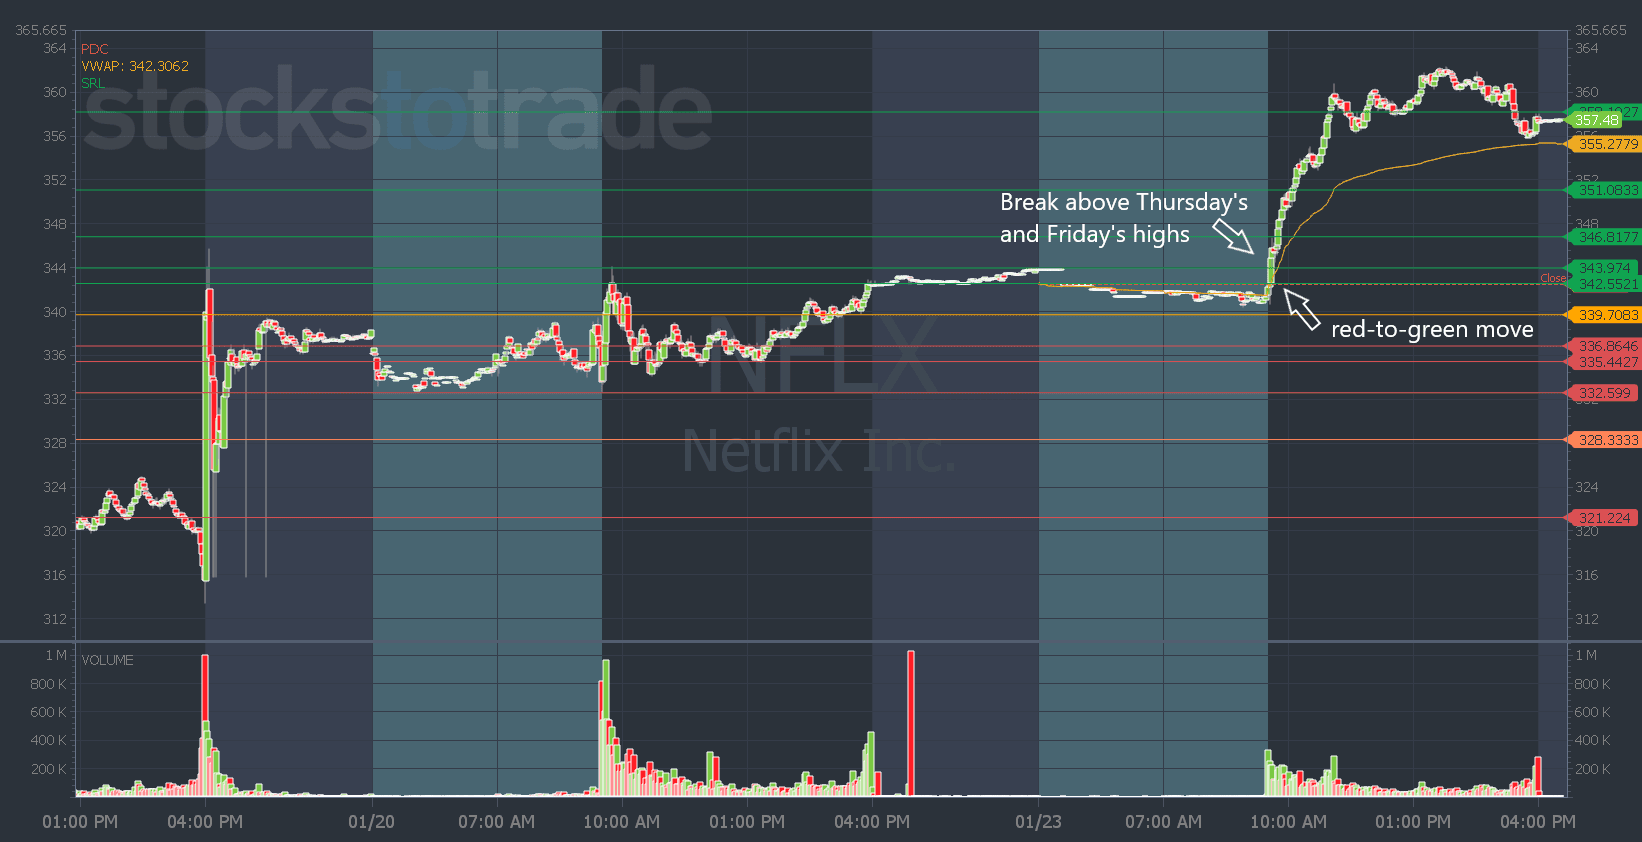
• RED-TO-GREEN moves are powerful because when a stock opens red, shorts think it’s the first red day and pile in. But when it goes green, they’re all wrong. And that’s the level where they should buy to cover.
In both cases, we want to buy when the shorts are buying. We want to take advantage of extreme human emotions and powerful upside moves.
When a stock has a big [first green day] with positive news and it closes near its highs, it’s almost always a watch for a [weak open red-to-green] move the next day.
What we look for after the big [first-day run] is for the stock to open weak. It opens red and that makes shorts think it’s the [first red day]…
Short sellers think they’re in control…
But the dip is brief and the stock reverses and goes green. That’s typically the level shorts use as their risk. And the buying starts there with shorts buying to cover and longs entering to ride the momentum…
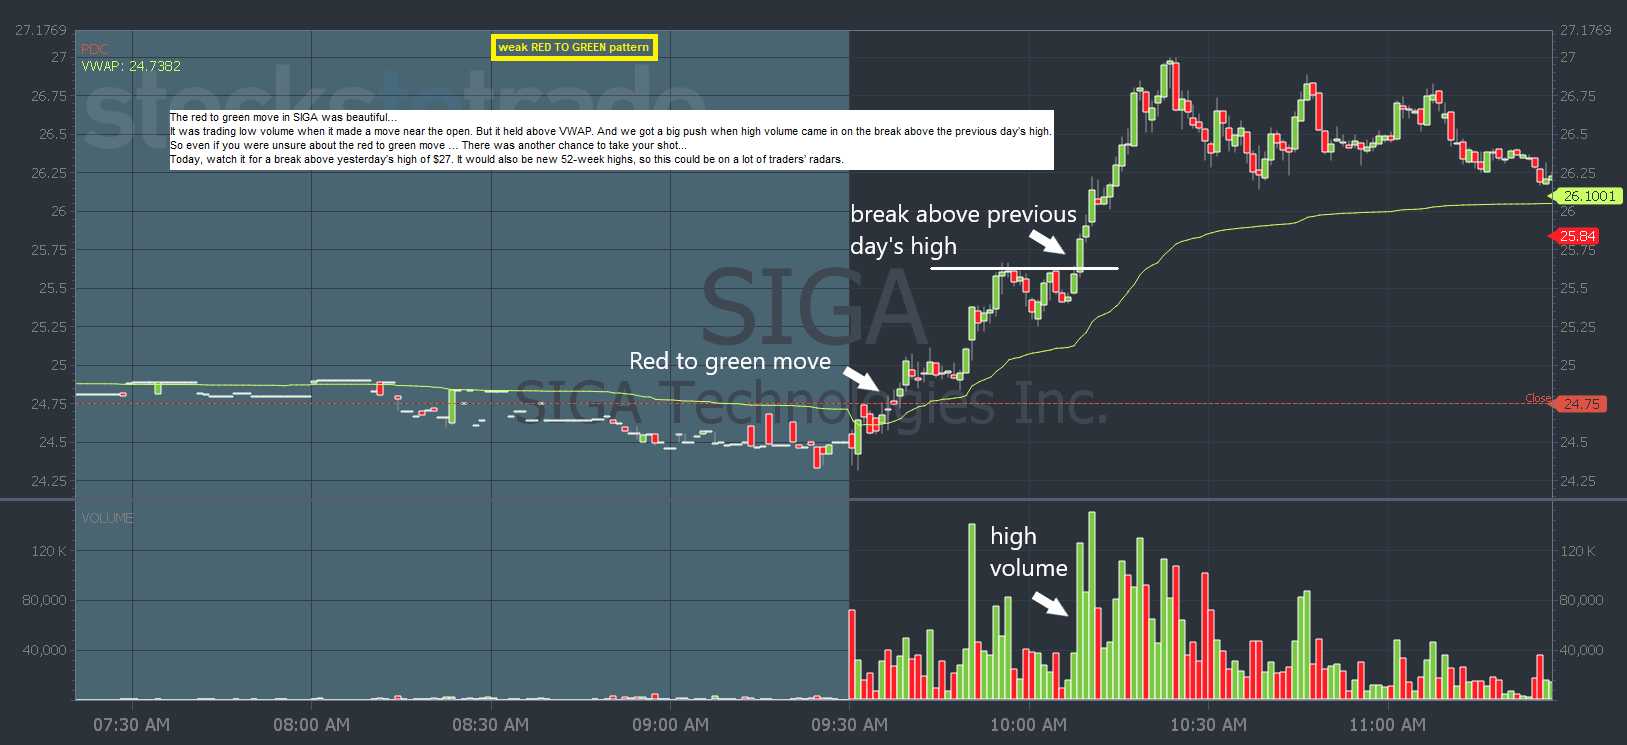
For this pattern, enter when the stock goes green. Then use VWAP or the low of the dip as your risk.
From there you can use Oracle support and resistance lines to guide your trade. -Bohen
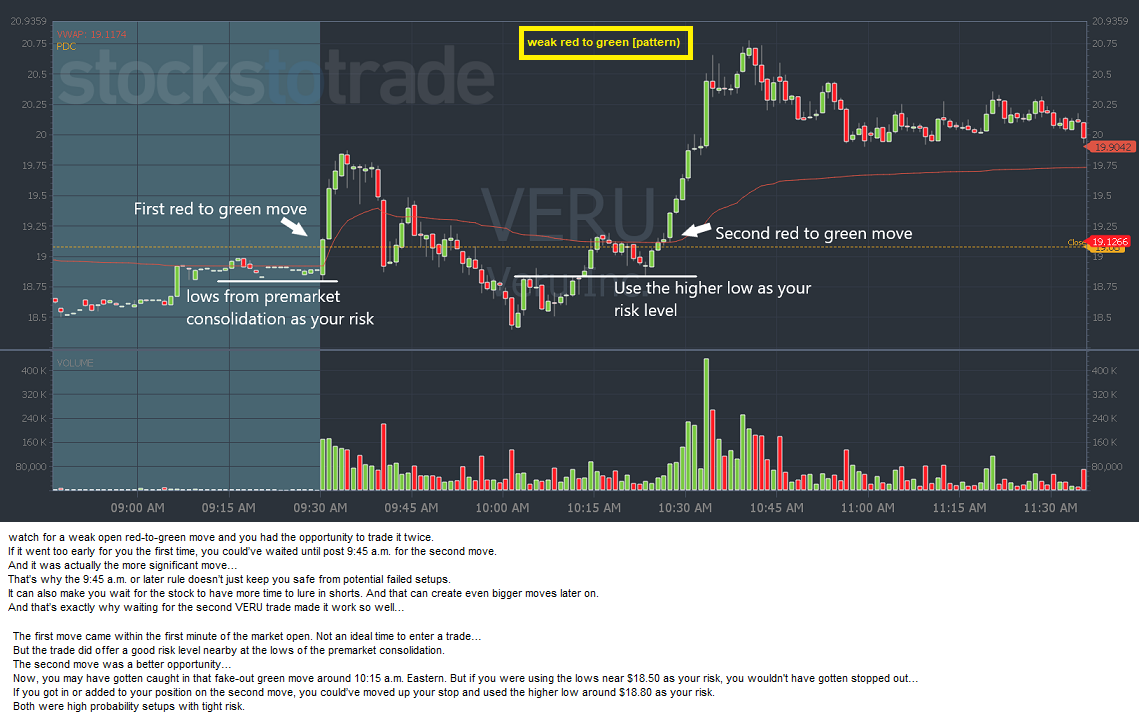
The great thing about the [red-to-green move] is that you can trade any time after the [first green day]. It’s great for [multi-day runners] and even day trading ‘real’ stocks that are uptrending.
a WEAK OPEN RED TO GREEN pattern is something that can happen everyday / every morning!.......
First Green Day: the stock gaps up (over 100%) hugely in the morning [even if it did nothing for 1 whole yr prior; even if it traded very lil volume over the past two years]. -Dux
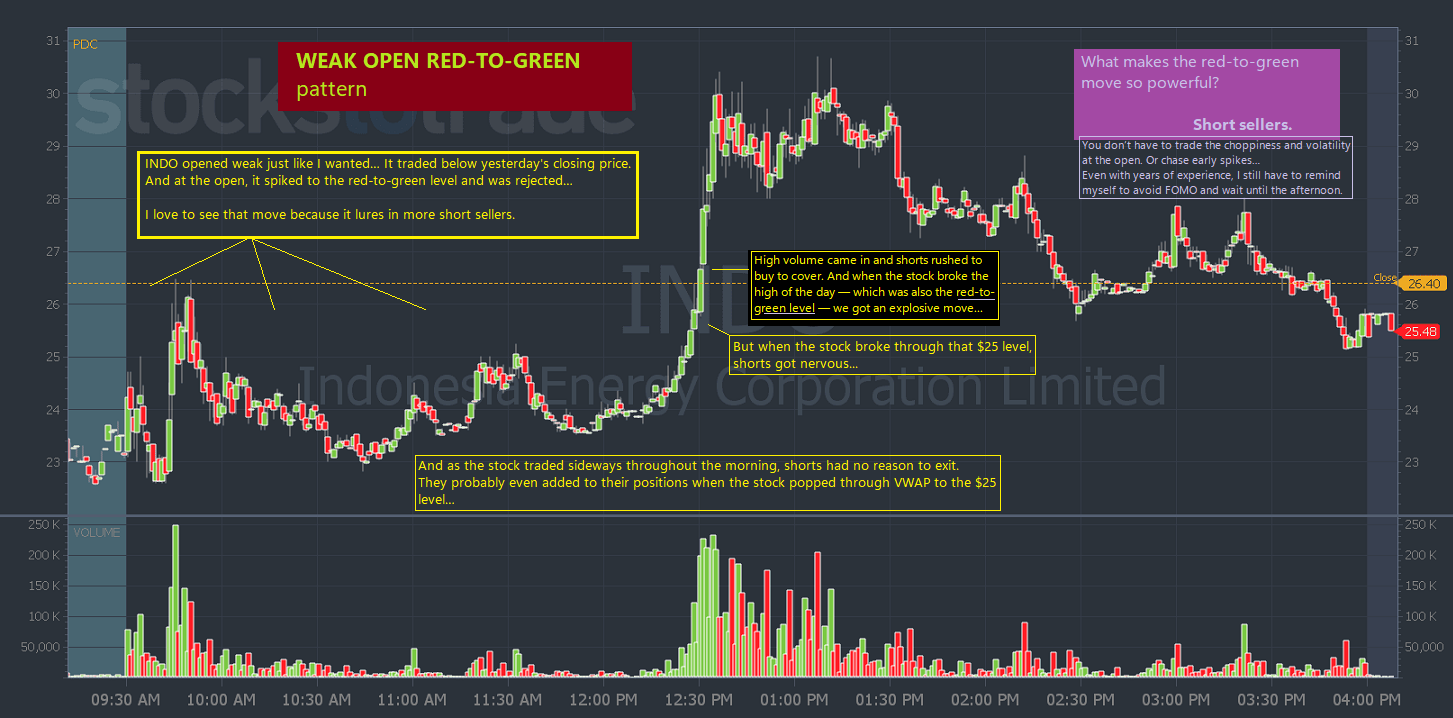
A red-to-green move occurs when a stock opens lower than its previous closing price. Then it rips back upwards and crosses above the previous day’s close. It can be a powerful move because the weak open draws in short sellers. And they typically use the previous close as their risk. So when it goes from red to green, shorts buy to get out, and that sends the stock higher. (this can all happen between 9:30 am - 11 am, or 2 pm - 4 pm). -Bohen #powerhour #redToGreen
You don’t have to be first. I don’t care about missing day-one runners. Plenty of stocks spike in the morning, then fade and gap down the next day. Don’t waste your time. -Bohen
Min 10 ------------ Sykes explaining what the FIRST GREEN DAY pattern is exactly --------- www.youtube.com/watch?v=1iUqguHWVpE ..........
HOW TO TRADE WEAK OPEN RED-TO-GREEN SETUPS
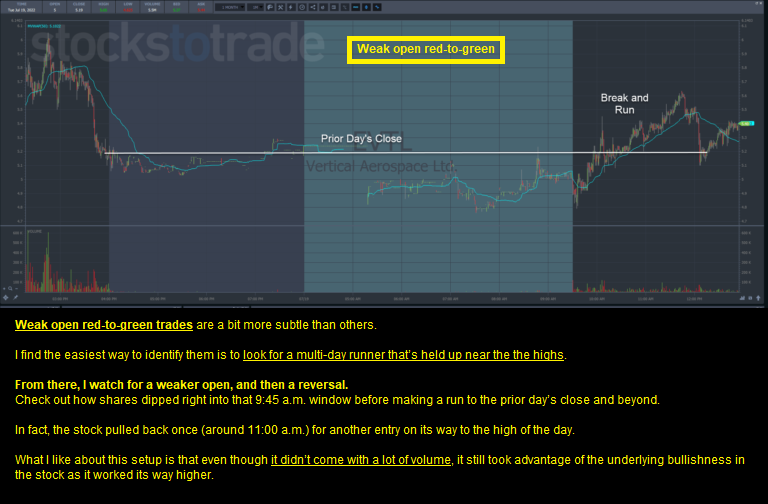
You’ve probably heard me talk about weak-open-red-to-green setups.
The idea is I find a stock that’s shot up on news and then held near the highs.
That effectively ‘traps’ short sellers near their stops [i.e. the high from the first day and the most likely place for shorts to stop out]..
If a stock manages to drop, they get an opportunity to exit at a profit.
But when the stock holds near the highs, it makes them nervous with an itchy trigger finger.
And most of them put their stops right at the recent highs.-Bohen
THE WEAK OPEN RED-TO-GREEN MOVE
Once a stock has a big day as SHPH did on Tuesday, short sellers pile in and short any pops in the afternoon.
And when it opens weak the next morning, shorts see that as confirmation that their thesis is correct and it’s going lower. So they add into pops in the morning...
You can see the long top wicks on the candles and high volume which shows selling pressure…
But once the stock goes green (i.e. it crossed above the previous day’s closing price), that’s when short sellers are wrong…
The move means the stock has more upside momentum. -Bohen
And if there is still resistance overhead at the previous day’s high and the after-hours high, shorts probably will add to their position…
That only adds more juice to the squeeze [short-squeeze potential!] -Bohen #greenToRed
Min 2:29:00 -------- when a stock has prior massive green-candle VOLUME SUPPORT at it's previous support levels, it is a very bullish factor ---- www.stevenduxi.com/trading-techniques-video-course/?_login=20b01b8e4b ........ #Dux #BREAKOUTS #DIPBUYS
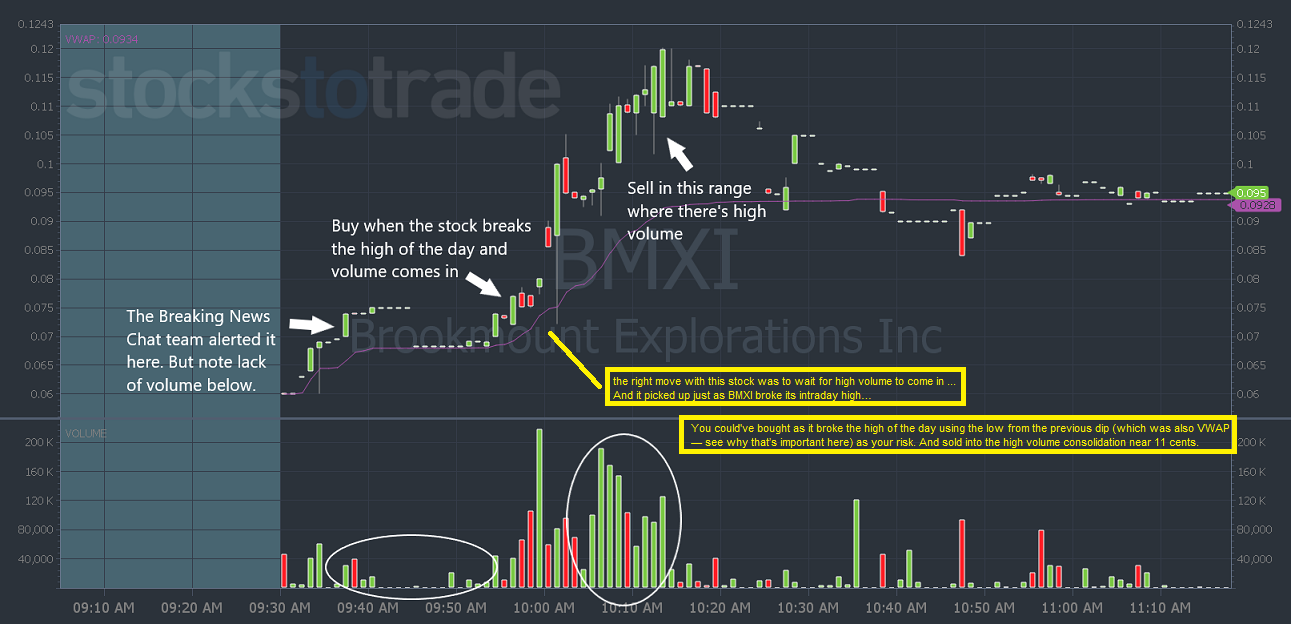
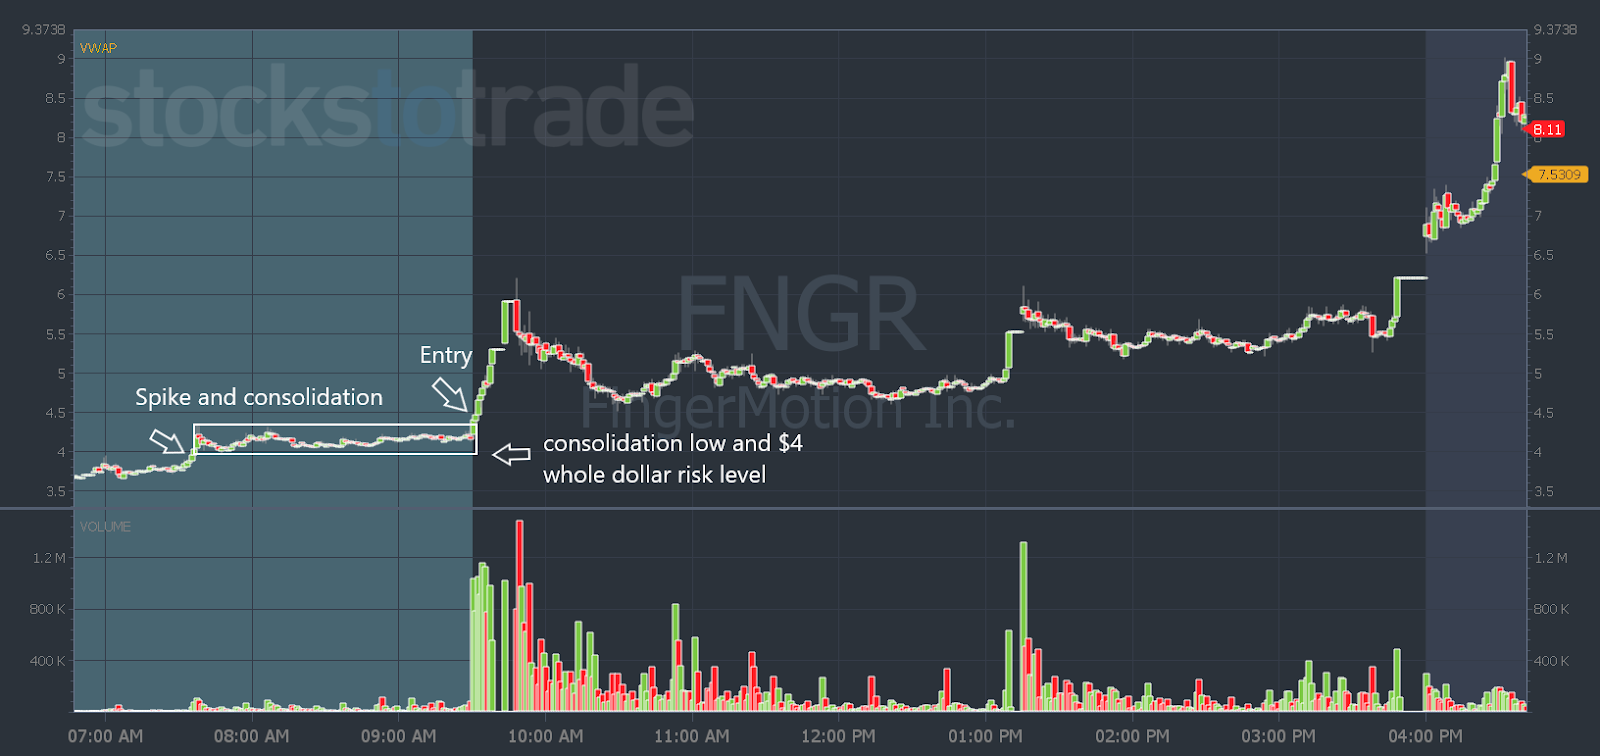
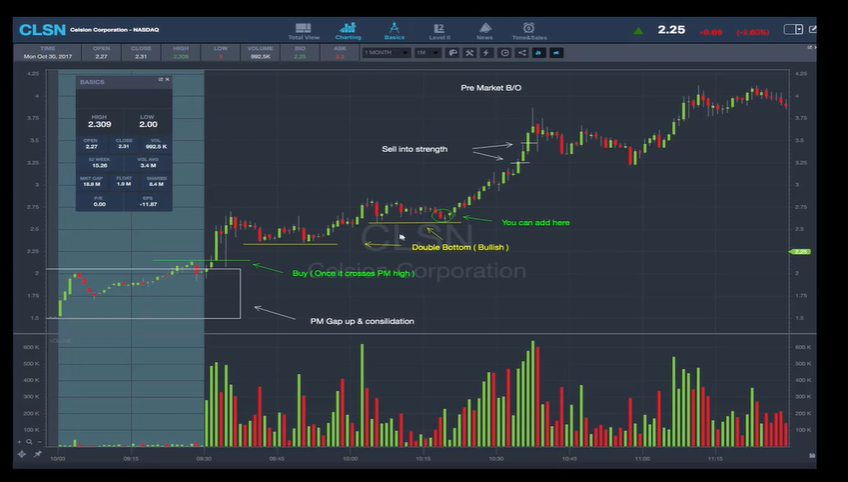
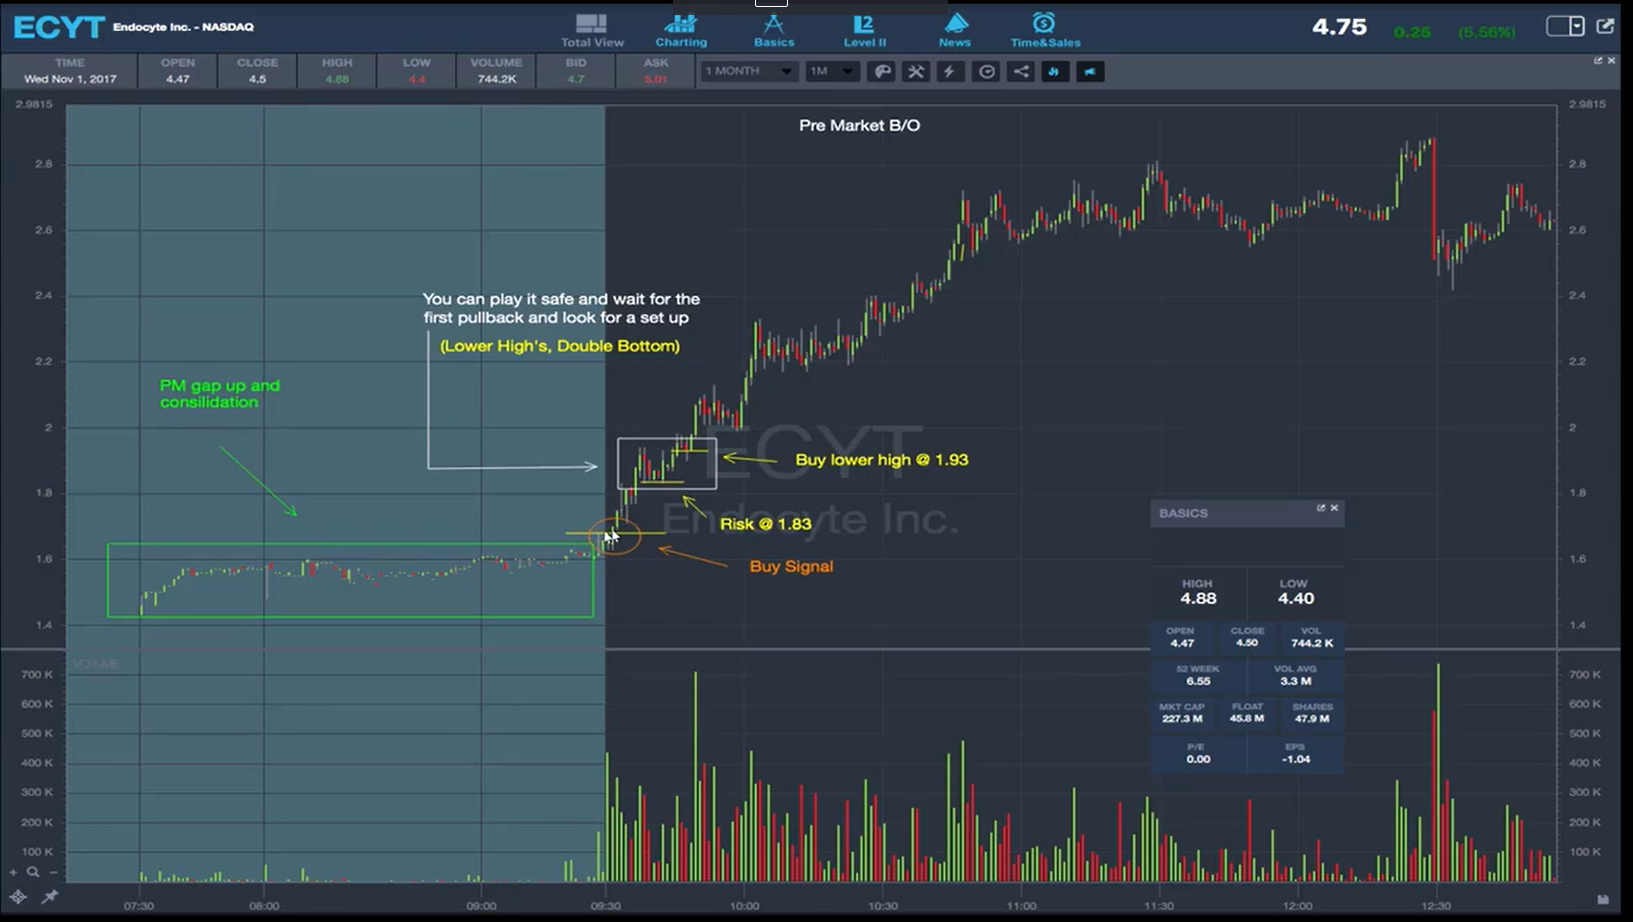
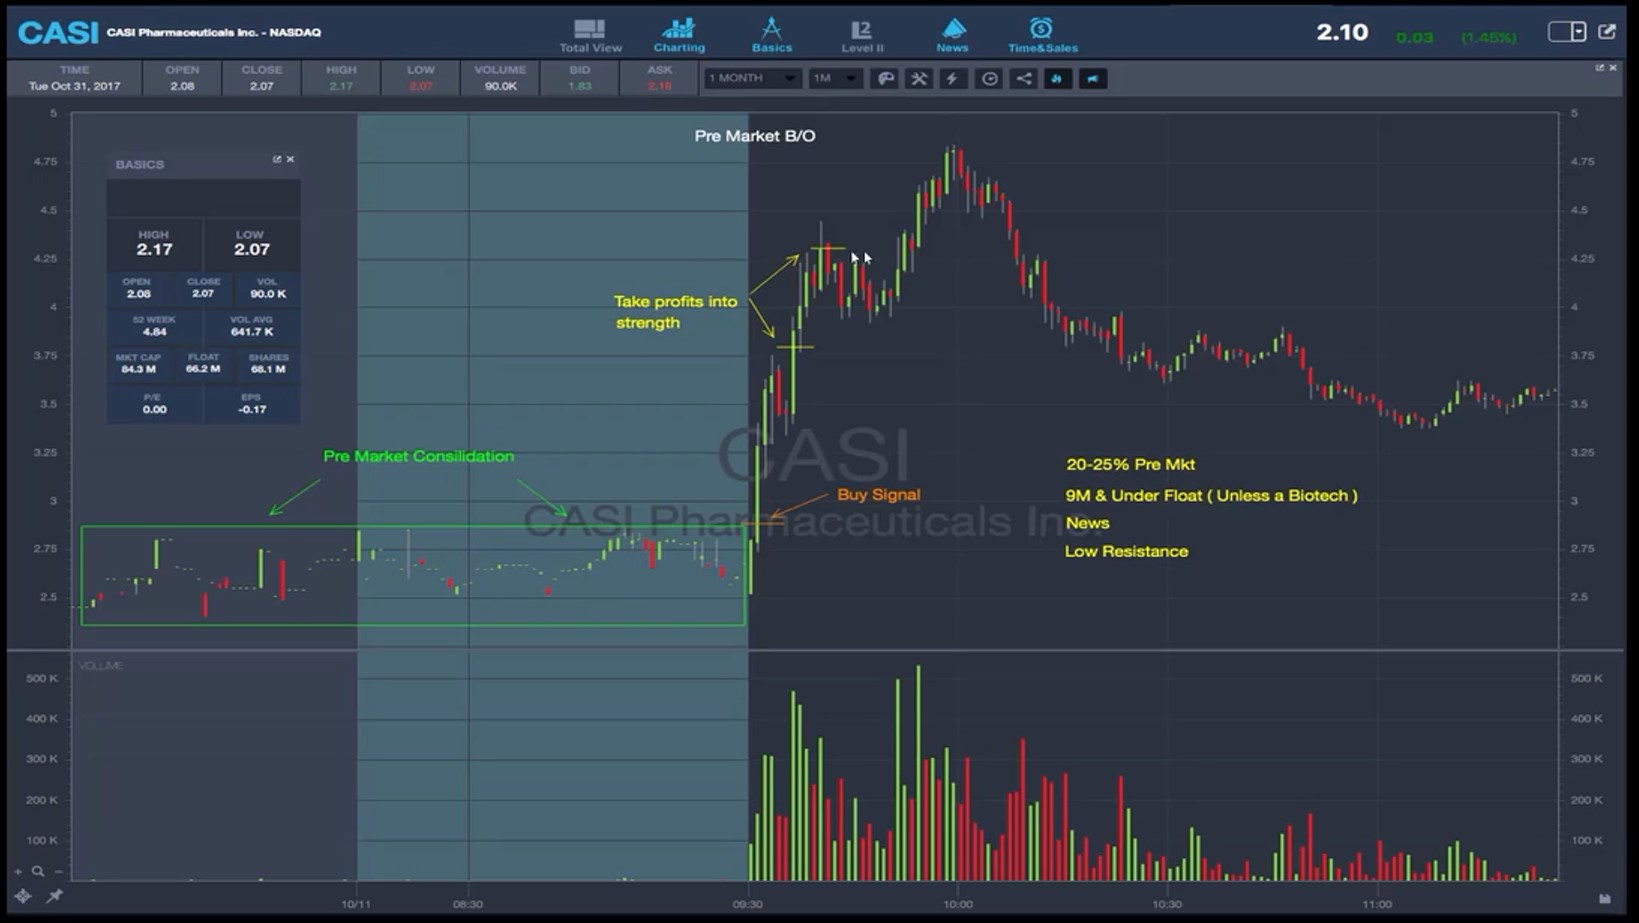
A [dip and rip] is a good pattern to look for during market open when a stock gaps up big in the morning.
It’s really easy to get caught up in the excitement when the market opens. But disciplined traders wait for the chart to shake out before making a trade.
By 10 A.M. Eastern, it put in a top. Then consolidated until just after noon.
That consolidation above a support level is when traders get in. That way there’s a clear level to cut a potential loss at. The closer a trader buys near consolidation, the less they risk. -Bohen
After a stock has a big move, and then stock closes strong on the day — it’s always a watch for a weak open red-to-green move THE NEXT DAY (look for the company to also drop a press release during the market open the next day). -Bohen
Min 4:20 --------- A stock becomes a potential #WORG (weak open red to green) pattern, if on it's previous day --- it closed on or around it's highs (on that same previous day) ---------- www.youtube.com/watch?v=tsyCnjC037k ........... #worg
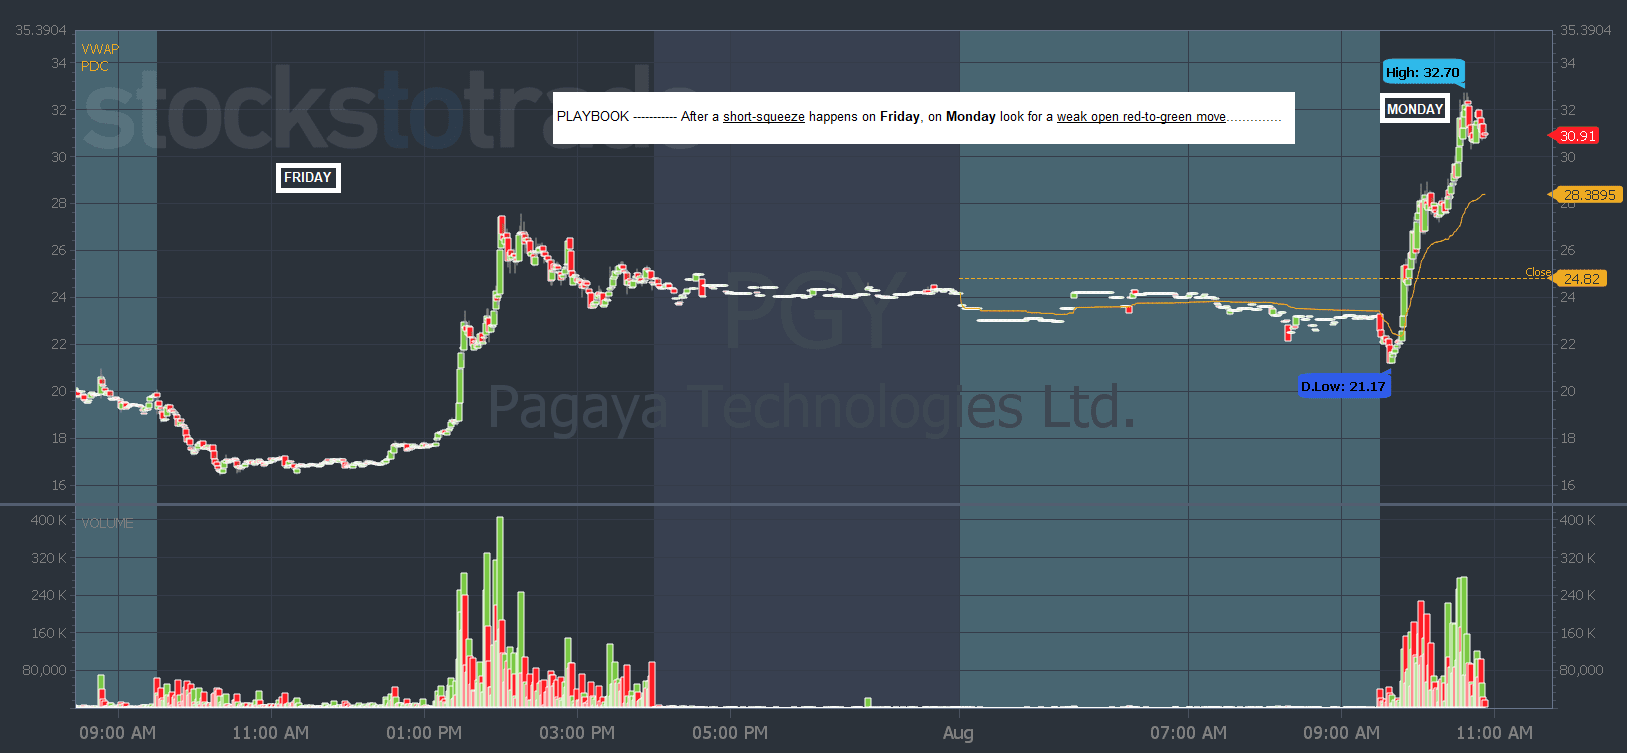
PLAYBOOK ----------- After a [short-squeeze] happens on Friday, on Monday look for a [weak open red-to-green] move..................
I like buying First Green Days... A third green day pattern is tough (not worth buying)... -Tim Sykes #PLAYS #PATTERNS
HOW TO FIND SUPERNOVAS ---------- to catch big spikers prior to their spiking, i gotta setup a VOLUME scanner........ no effin doubt........ i must experiment with volume scanning to catch moves on the #1 pre-ramp #2 ramp, etc................. or use the NEW HIGHS scanner.
A key component of the [weak open red-to-green] move is for the stock to close at or around the high. If the stock trends sideways after its big run-up, then the [weak open red-to-green] plan will be in effect. Because when it closes near its highs, it doesn’t create bagholders and give traders regret. -Bohen #worg
I don’t love sketchy biotechs, especially on their [first green day]. These sketchy companies are known to drop offerings to take advantage of their increased stock price. And that usually sends the stock off a cliff. No thanks. To me, it’s not worth the risk. -Bohen #biotechs #firstGreenDays #offerings
If a stock closes in the afternoon near its MORNING HIGHS (i.e. the highs it hit prior to 12 pm that day), then it can have a weak open red-to-green move the next day potentially. -[Bohen commentary] #worg
Min 37 --------- How to ensure a massive supernova spiker doesn't have many bagholders still in the stock (so it can keep spiking instead of selling off and tanking due to bagholders selling to break-even or minimize the amount of losses they're holding) -------- https://www.youtube.com/watch?v=zvs_8zF-i1E ..........
For me, First Green Days are great for risking low of day. I've been trading FGDs for a long time now, and i know the best spot to risk for the highest chance of having a winning trade is LOW OF DAY. So LOW OF DAY is my risk (that's a good thesis)... First Green Days also don't always run the furthest because there's bagholders in there. -Monaco #FirstGreenDays #bagholders #FGDs
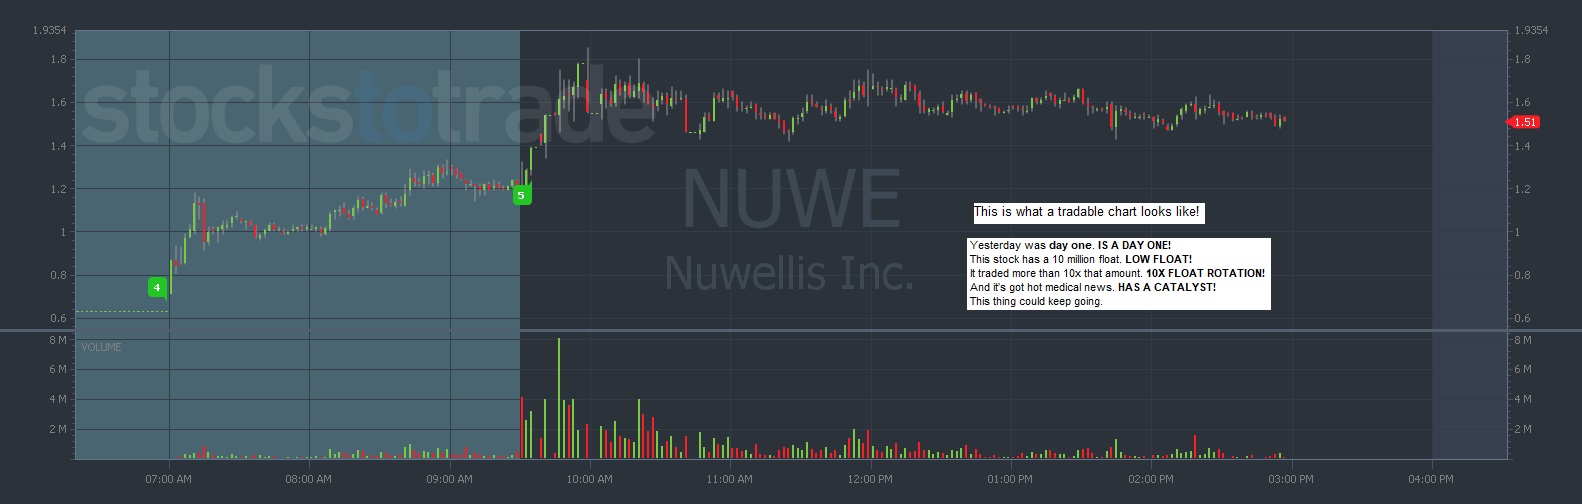
A stock can have only so many Float Rotations (only so many maximum number of times) before it drops back down in price. -[Dux commentary] #floatRotation #rotation
100%+ Premarket Squeezers [vs] Multi-Day Runners
Which would you rather trade: A premarket squeezer on the 1st day or a multi-day runner?
My money’s always on the multi-day runner.
Why?
Because multi-day runners have something these fly-by-night stocks don’t … PROOF!
let me tell you a little secret … A stock can run for days but usually fails once!
That’s a big reason why I don’t like the sketchy biotechs that pop on news.
Instead, I prefer stocks that show me over a series of days, if not weeks, that they want to move higher.
Many traders struggle to find these stocks for two reasons:
- Multi-day runners have news that dropped before the current trading day
- Traders miss the trend reversal
If you don't know where the top of a spike is going to be, always sell into the pre-market high (check the top tick in the pre-market and sell there)... -Dux commentary
WEAK OPEN RED-TO-GREENS CAN LEAD TO SHORT-SQUEEZES
weak-open-red-to-green setups are pretty similar to day 3 surges.
The idea is I find a stock that’s shot up on news and then held near the highs.
That effectively ‘traps’ short sellers near their stops.
If a stock manages to drop, they get an opportunity to exit at a profit.
But when the stock holds near the highs, it makes them nervous with an itchy trigger finger.
And most of them put their stops right at the recent highs. -Bohen
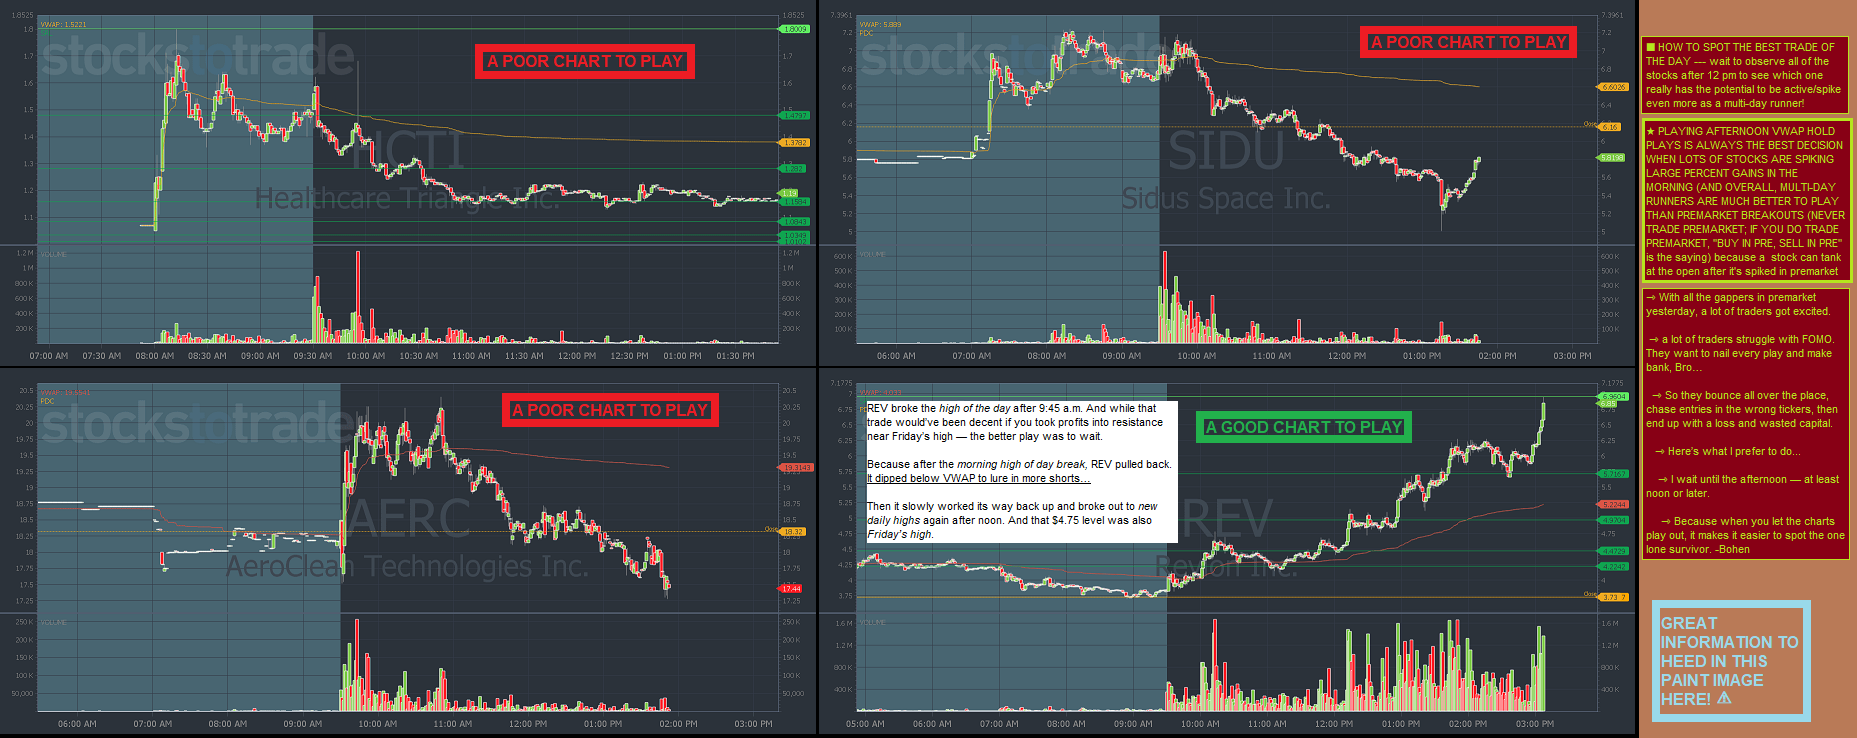
■ HOW TO SPOT THE BEST TRADE OF THE DAY --- wait to observe all of the stocks after 12 pm to see which one really has the potential to be active/spike even more as a multi-day runner!
★ PLAYING AFTERNOON VWAP HOLD PLAYS IS ALWAYS THE BEST DECISION WHEN LOTS OF STOCKS ARE SPIKING LARGE PERCENT GAINS IN THE MORNING (AND OVERALL, MULTI-DAY RUNNERS ARE MUCH BETTER TO PLAY THAN PREMARKET BREAKOUTS (NEVER TRADE PREMARKET; IF YOU DO TRADE PREMARKET, "BUY IN PRE, SELL IN PRE" is the saying) because a stock can tank at the open after it's spiked in premarket
⇾ With all the gappers in premarket yesterday, a lot of traders got excited.
⇾ a lot of traders struggle with FOMO. They want to nail every play and make bank, Bro…
⇾ So they bounce all over the place, chase entries in the wrong tickers, then end up with a loss and wasted capital.
⇾ Here’s what I prefer to do...
⇾ I wait until the afternoon — at least noon or later.
⇾ Because when you let the charts play out, it makes it easier to spot the one lone survivor. -Bohen
HOW [low float] PATTERNS TYPICALLY PLAY OUT DURING THE DAY ON A STOCK THAT CLOSES HIGH ON THE PREVIOUS DAY ------- after a stock closes high, the next day it has the chance to be a::::::::::: WEAK OPEN RED-TO-GREEN ▶ DIP AND RIP ▶ AFTERNOON VWAP HOLD... once all the shorts are done, once all the shorts are out --- then the stock will collapse. -[Bohen commentary]
Min 5:20 ---------- the [weak open Red-to-green] pattern refers to when a trade opens below the previous day's close (at 4 pm, the day earlier), and then trends above it -------- www.youtube.com/watch?v=uERBVWFNjbs .......... #worg #red-to-green
SSR can help the stock SPIKE --- when the SSR is on the ticker ON THE FIRST GREEN DAY, the ticker leans toward being BULLISH. -Dux <---------BE SURE TO TRACK SSR
Min 3:33:00 -------- HOW TO PLAY First Green Days, Second Green Days, Third Green Days --------- PART 2 ------ www.stevenduxi.com/trading-techniques-video-course/?_login=ddc225352a .........
[Weak Open Red-to-Green] plays need a bit more of your attention.
You have to change your alert levels each day or watch the stocks closely for the move...
You also have to monitor them near resistance levels to determine if you want to take any potential profits or see if it can break above resistance and keep going higher. -Bohen #worg
Min 19:30 ------- VOLUME PROFILE is a great little indicator to use to identify bagholders, and support/resistance level --------- www.youtube.com/watch?v=lsyPVXhgyeY ........ #Bao #indicators #volumeProfile #bagholders #bag-holders
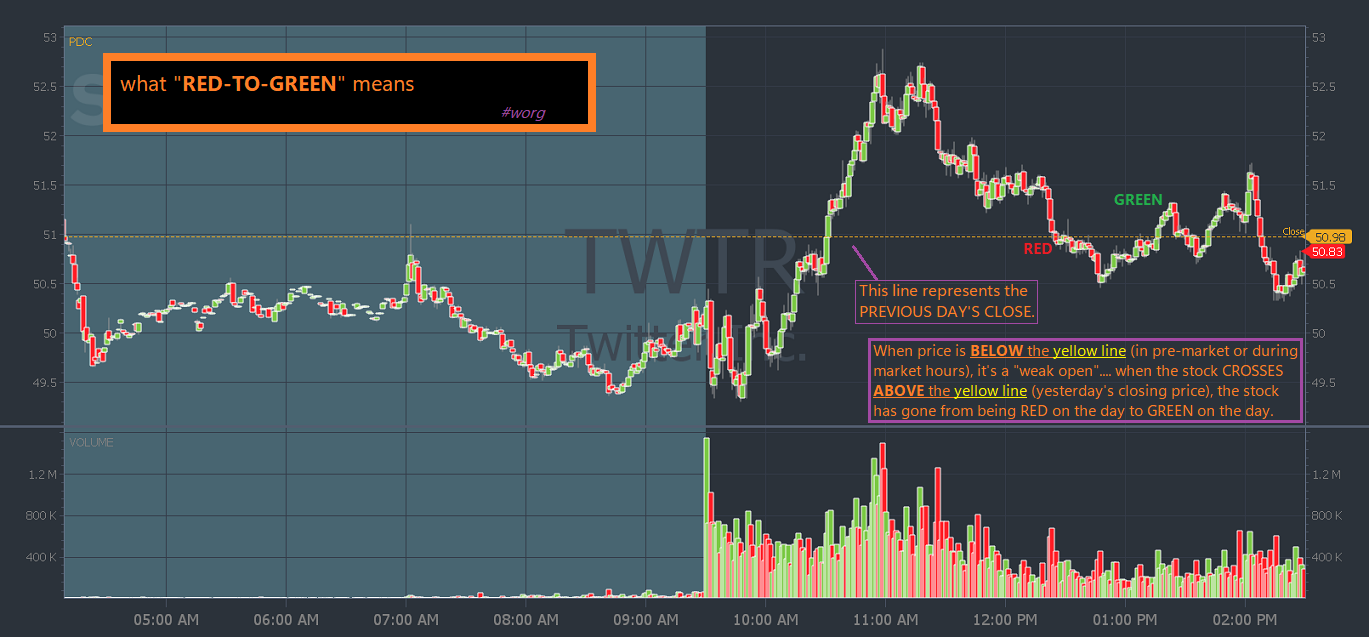
WHAT ""WEAK OPEN RED-TO-GREEN"" MEANS
The yellow dotted line on the chart in STT represents the stock's "previous day's closing price"... If the stock's price is BELOW the yellow line (the next day, during pre-market or market hours), that means the stock has had a "weak open".... If the stock CROSSES ABOVE the yellow line (if it crosses above "yesterday's closing price"), the stock has gone from being RED on the day to GREEN on the day. #worg
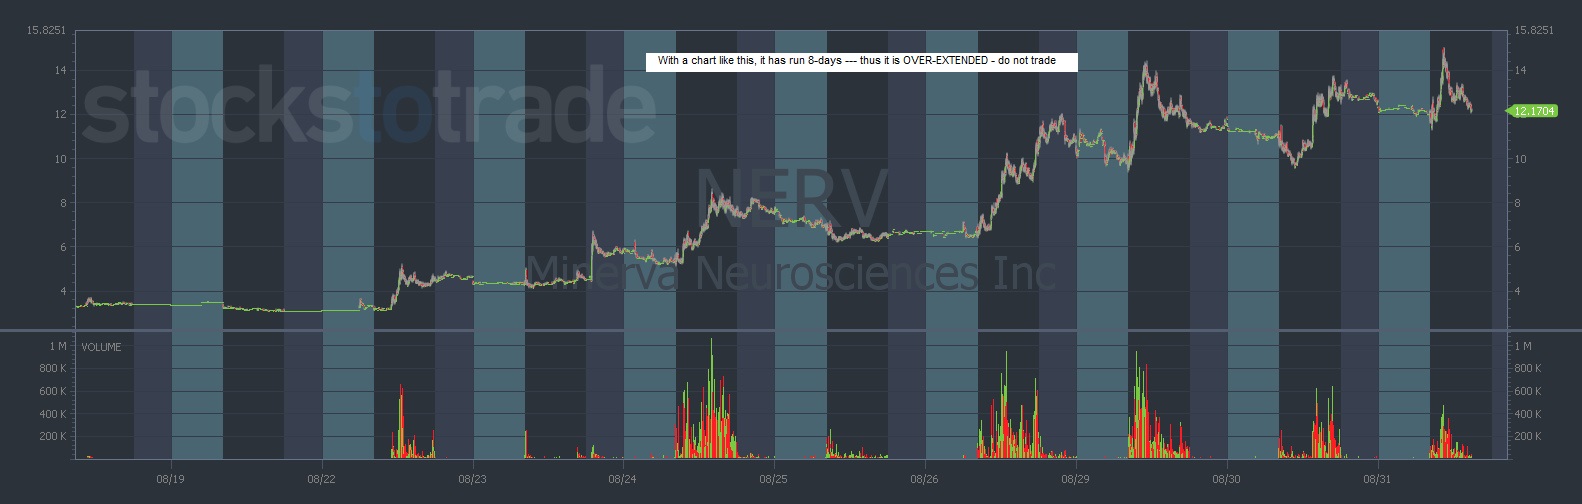
WHEN LOOKING AT A CHART, ALWAYS ANSWER: HOW MANY TIMES IN THE PAST (10 DAYS) WAS THE STOCK STUFFED(REJECTED) AT ITS NEAREST/HIGHEST RESISTANCE LEVEL?
When a stock that is on the verge of breaking out tests critical resistance levels, and gets stuffed multiple times, that can hint that the stock has nothing to give (isn't a good trade to play).
THE MINDSET OF TRADERS IN A STOCK THAT IS HITTING RESISTANCE ON THREE OCCASIONS OVER THE PAST 5 DAYS (Day 1, Day 3, Day 4)
There are likely three traders left in the stock:
1. those who bought in early, either haven’t taken profits or took some (and they'll want to sell into any spike before the weekend comes)
2. those who came late and bought somewhere after the run (they'll want to sell into any spike before the weekend comes)
3. short-sellers in the stock - there probably aren’t many of them left b/c the stock hitting resistance levels prior probably scared them to take profits in between (so short-squeeze odds are pretty slim)
* thus anyone buying into the stock (especially if it's on a Friday) is likely to get stuffed.
** Now, had shares pulled back some, that would give shorts a chance to accumulate and longs reset (a substantial pullback all the way back towards the low of the breakout candle is a positive factor).
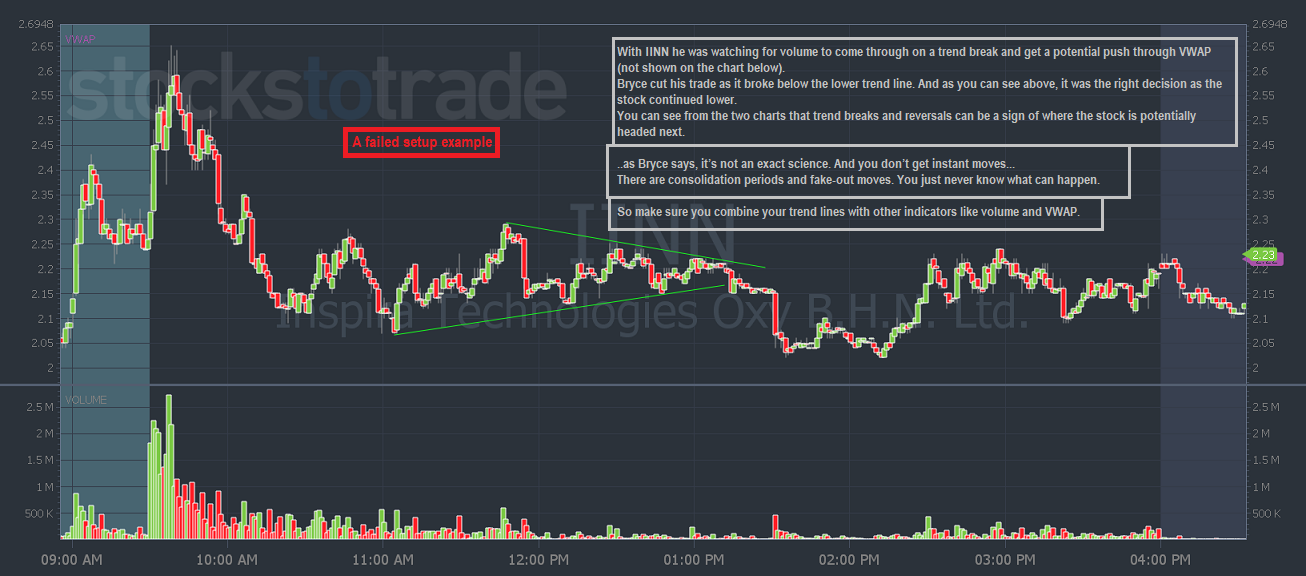
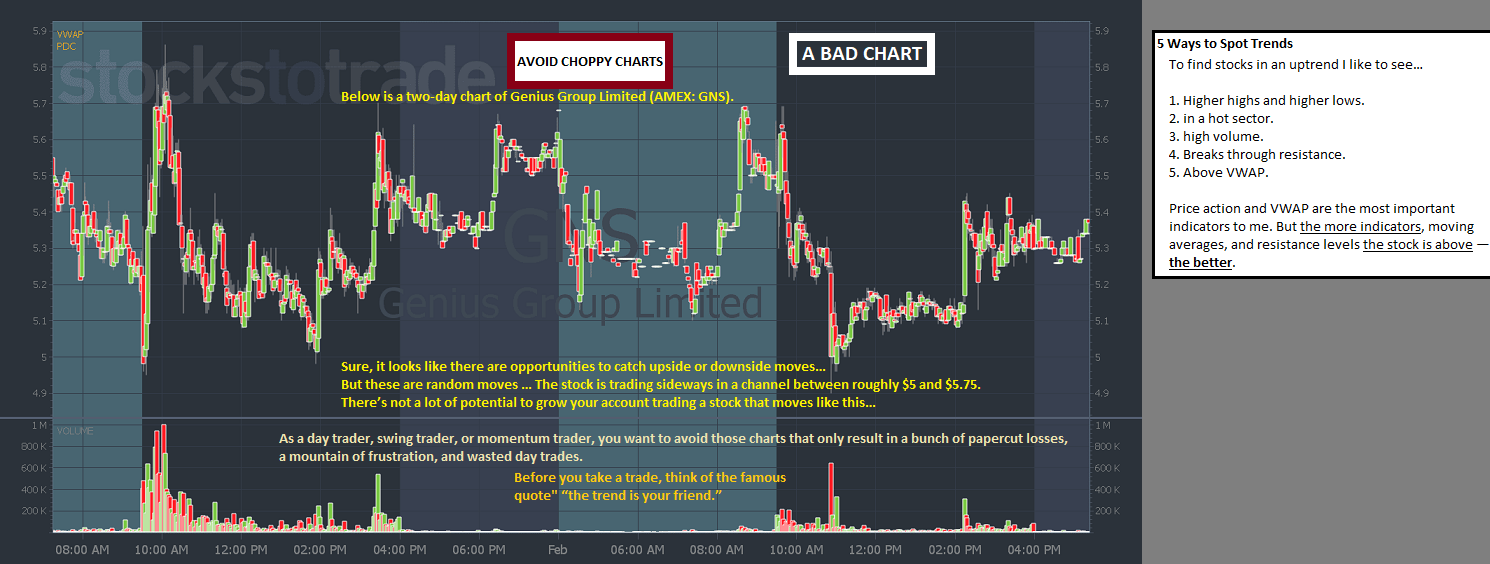
GET A FEEL FOR THE STOCK'S MOVEMENT
Just like humans, stocks need time to recuperate.
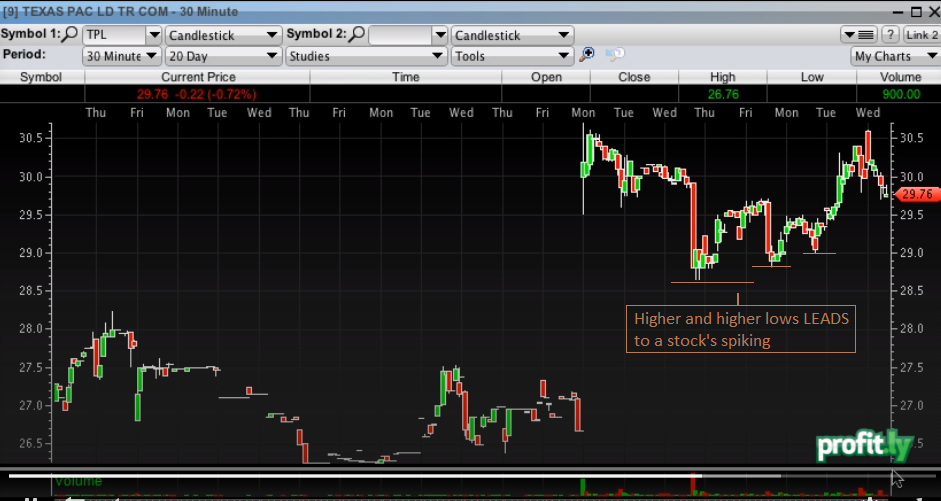
Nothing goes up in a straight line.
You can think of the price action as energy. Each huge movement expends energy.
Naturally, they need time to rest.
Sometimes this can take a few days. Sometimes it can take a few weeks.
The tickers that trade the most VOLUME are the ones that end up running/spiking large percentages. -Alex Salf
FIRST GREEN DAYS can lead to DAY 3 SURGES
For all stocks that were a First Green Day, keep them on tabs for being DAY 3 SURGES, DAY 4 SURGES, DAY 5 SURGES (especially on FRIDAY within that same week that it was a FGD).
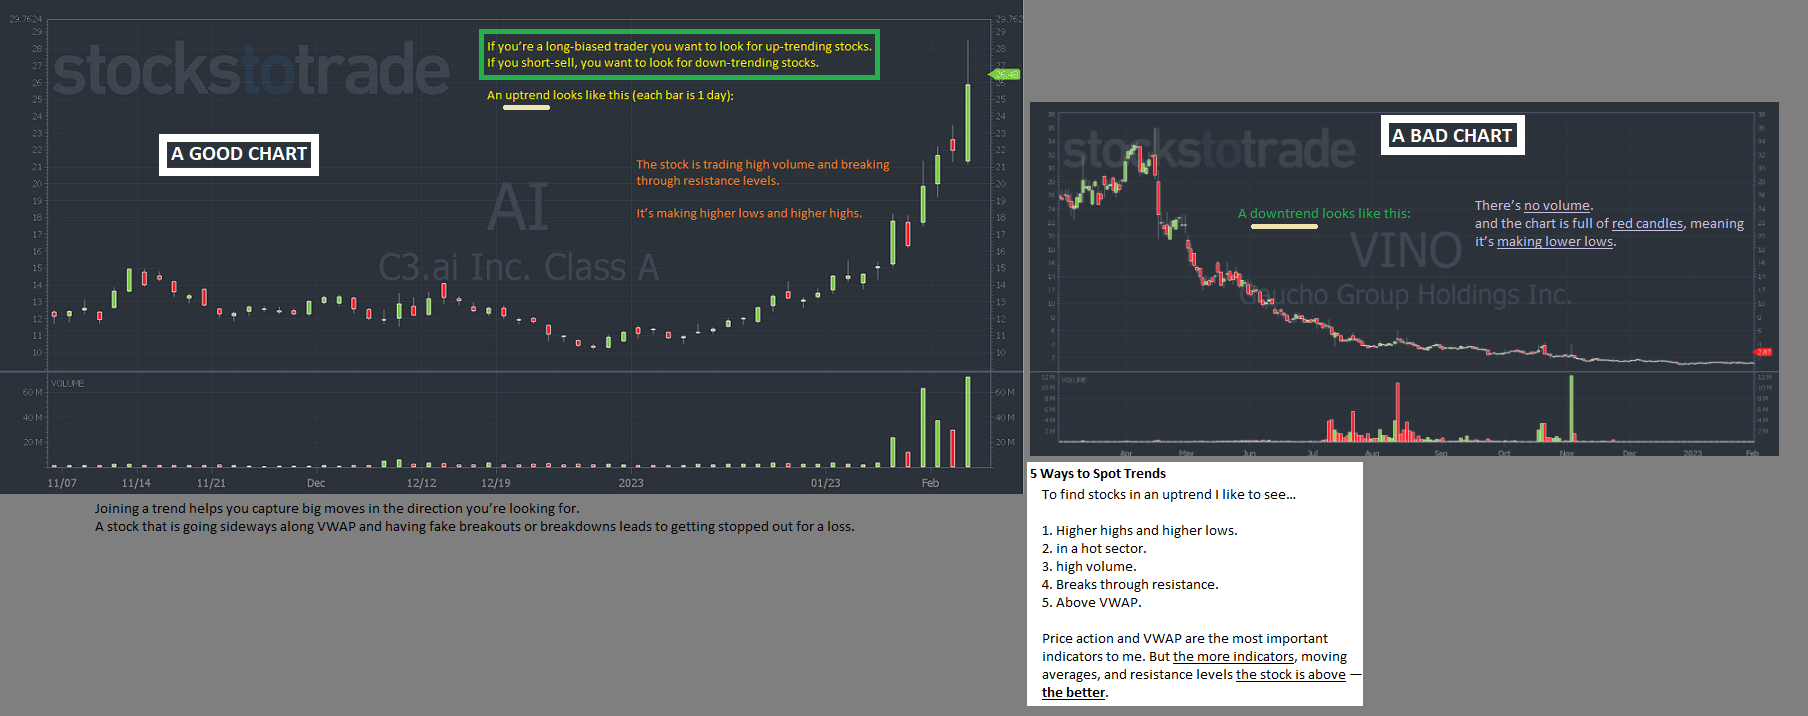
The First Green Day Pattern
First green day patterns often emerge after stocks have been in steady downtrends (or after they’ve hit blow-off tops).
If you see a daily chart with a long string of red candles in a row, it might be worth putting that chart on watch for a potential first green day soon.
Sykes brilliantly identified that first green days can have EXPLOSIVE price action to the upside. It doesn’t happen every time, but it’s pretty darn consistent.
IF A STOCK SPIKES ON A FIRST GREEN DAY: keep it on watch for weak open red-to-green moves, dip and rips, or afternoon trades. And if it dies, it dies. -Bohen
Check the dip and rip charts above: should PREMARKET CONSOLIDATION be one of the factors i look for when buying the dip and rip circa 9:45 am????????????
(we love it when a stock can) open (at 9:30 am) near the pre-market highs... That tells me not only is there bullish momentum in the stock, but I can look for a quick push higher, a slight pullback, and then a bump to the next level. -Bohen #premarketBreakout
HOW MICHAEL GOODE SCANS FOR SUPERNOVAS
• show stocks where close gained more than 99 percent over the last 5 days
• price is between $0.25 CENTS and $15 dollars
• average day range is above 8
• volume is greater than 500,000
The Key to Catching Big Biotech Gains
The biggest problem with trading biotechs is that most traders don’t know about them until it’s too late…
They see a stock that’s up 100% or more, then jump in without a plan or knowing why the stock’s even up.
Or worse, they don’t see the stock until the next day. Then they try to DIP BUY it when the move’s already over.
Let me be clear: Biotech stocks are not DIP BUYS.
To catch big biotech runners, your best odds are to catch the first-day move. When biotech companies announce news, that can bring in high volume and hype... -Bohen #biotechs #breakouts #dipbuys #chasing #fomo
DO NOT HOLD BIOTECHS OVERNIGHT OR SWING TRADE BIOTECHS!
Day 1 of Biotech stocks usually offers the best trade opportunities.
So if all these biotechs eventually fail, what do I mean when I say the biotech sector is hot?
Well, I don’t mean you should buy biotechs with no news and no volume. And I certainly don’t mean buy morning Biotech runners and hold for multi-day runs…
That’s not how the biotech sector works.
When the biotech sector’s hot, watch for the next sketchy biotech stock with news.
Focus on day trade patterns only. When you see profits, take profits. -Bohen #biotechs #breakouts
HOW TO TRADE SKETCHY BIOTECHS
These sketchy stocks run on news and hype around potential treatments for things like cancer, Parkinson's, and diseases you’ve probably never heard of.
Biotech news catalysts and hype can create great trading opportunities...
But there's a dark side to these stock market darlings.
◆Biotech stocks create great trade opportunities. Their news catalysts excite a lot of traders. But not all biotech news is created equal…
Some headlines can move stocks for multiple days. Other news may create spikes that quickly fail.
Why?
◆News about well-known diseases like cancer, Parkinson's, and Alzheimer's can create bigger moves. These diseases impact many people and have no cure. That strikes a nerve with people and triggers emotions…
Traders want to believe these companies will find a cure and save the day. They may also think the stock will be the next Moderna, Inc. (NASDAQ: MRNA). So they chase entries and hold.
◆But believing in these companies is the biggest mistake you can make with biotechs.
99.99% of biotechs fail.
◆Don’t hold biotech stocks long term or believe any of them will deliver on their promises.
Biotech stocks are day trades only.
➜Trade the news, momentum, and hype. Stick to your pattern and setup, then move on. And when a stock dies, it dies.
◆Don't bag-hold sketchy biotechs. -Bohen #biotechs
TRADE LOGICALLY — DON'T TRADE IMPULSIVELY
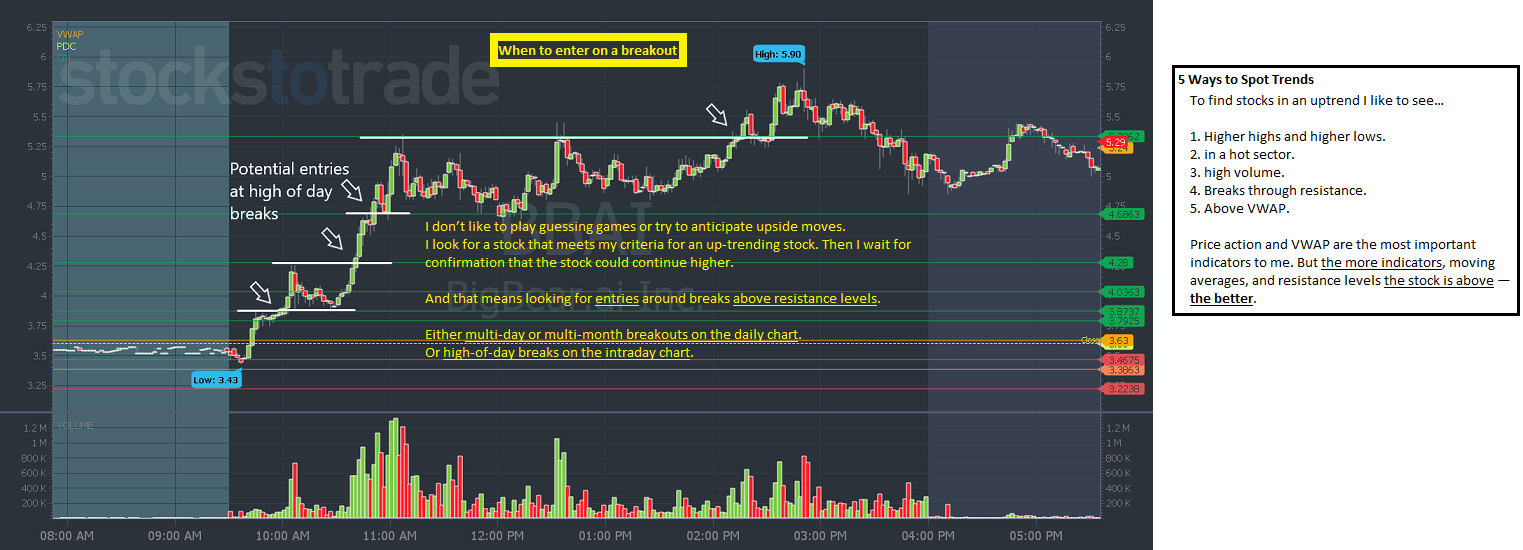
You don’t have to be first into any stock — even if it has what you think is good news.
Remember: We don't play guessing games...
➜ Wait for a stock to prove that the news matters…
Watch for a price spike with high volume. Look for key levels to form. Prepare a trading plan. -Bohen #news #catalysts #patience #diligence
Look for the next potential big gainer by looking for stocks in the same sector and with the same characteristics as recent runners. -Bohen
The [red-to-green] pattern can be in play any day of the week, but it works especially well on Monday mornings in stocks where shorts are stuck. They get stuck after a stock has a big Friday squeeze... This is why Fridays and Mondays are my two favorite days to trade. It’s all about the psychology behind the trade and finding the right level to join the movement to the upside. -Bohen #short-squeeze #squeeze #shortSqueeze #worg #red-to-green #fridays #mondays
[#FIRST GREEN DAY pattern]
QUESTION: when you say this is what a FGD (first green day) is suppose to do, what are your main criteria for a FGD? I struggle to spot if it's a meaningful FGD or just a green day, cheers.
MONACO: As an example, the stock went from $5.91 to $27.5 in 3 days and then it started to fade. A FGD, to me, is when a huge run happens, then it crashes for several days... You will look for a day when it bounces. There were a few days where it tried, but it failed. Today, it has gone green and is holding nicely with some nice moves.
QUESTION: Regarding the questions you answered about $KSCP(1/14/2022). Is there any particular indicator you noticed about it today, that made you think today could be the day for its FGD?
MONACO: I watch for higher than normal Volume. Look at the daily chart and compare the volume from the run up, then the next several days had little volume, then (now, today) there is (lots of volume) today.
-
SYKES: Do you like this setup: first green day with some news?
JACKAROO: I like it too because it's a Friday. . .
SYKES: exactly!. . . so all weekend they're going to hype this up. . . It's an upcoming news kind of play. . . [I literally like the fact that it's closing strong; former supernova; let the promoters pump it all up with the good news].. . . I LOVE WEEKEND PLAYS. . . the hype can really spread. . anybody who hears about the news all weekend long cannot trade it after hours today, cannot trade it pre-market; all the buy orders are going to stack up theoretically on Monday morning. . . .
HUDDIE: Friday is the best day to swing stocks. . .
Min 14:35 ---------- THE NUMBER ONE DAY FOR DAY-TRADING IS MONDAY MORNING. You must be up at 4 am, 5 am, to catch these pre-market spikes... A close second is FRIDAY AFTERNOON ---- https://youtu.be/HDChGGfg2s4 ..........
After a big run/SPIKE / a GAP UP on Day 1 (or any day of a stock being in play), you can expect to see some profit-taking and pressure from short-sellers... THIS LEADS To the stock being a watch for a [dip and rip] or a [weak open red-to-green] move the next morning... this pertains to a stock with NEWS, LOW FLOAT, HIGH VOLUME, and HEAVY FLOAT ROTATION. -[Bohen commentary]
A premarket breakout pattern can be a pattern that appears on a FIRST GREEN DAY chart... -[Dux commentary]
Min 27 ---------- big-time gems on VOLUME -------- too much VOLUME in the MORNING makes the stock drop in the afternoon ------- https://youtu.be/A72ereAb9xc ........ #Volume #dux
____________________________________________________________________________________________________________________________________________________
TRACK:
- Does the stock have good news?
- How has the stock reacted to good news historically? (explain the consistent next 5-10 day candles following the stock's supernova/spiking)
