DAY 3 SURGE
__________________________________________________________________
CRITERIA (for A+ setup of the pattern)
use STT's """"Biggest % Gainers Over 5 Days"""" scanner (i.e. open a new tab in STT, click "scans"), to find stocks in the past 5 days that have the potential to reach their highs toward the END OF THE DAY.... these can make for SHORT-SQUEEZE potentials.....as it makes shorts nervous to hold overnight / over the weekend.... especially if these stocks meet the rest of my criteria below.
Day 3 criteria:
- a *breakout above* DAY 2 highs (great if also a breakout above Day 1 highs)
- high volume
- in a hot sector (is a Biotech, that's great)
- is Friday (Friday's create a higher probability for pattern to play out)
- heavy float rotation
- recent runner (within 1 year has spiked 100%)
- low float
Where to set STOP LOSS:
- at Day 2's highs (Day 2 resistance = Day 3 support level)
- at VWAP
- at nearest WHOLE DOLLAR / HALF DOLLAR level
- at previous Day's close
Where to take PROFITS:
- at Day 1 resistance levels (if Day 1 resistance is above Day 2 resistance)
- at my Profit Target of 6% or 8 % or 10% (whatever my excel spreadsheet risk/reward level is).
- above the next nearest resistance after Day 1 resistance is broken
- at my would be Profit Target (6%, 8%, or 10% gain) after Day 1 resistance has been broken.
Min 22:55 --------- HOW TO MANAGE MY TRADE (I.E. RAISE MY STOP LOSS HIGHER IF THE TAPE IS HOLDING A LEVEL HIGHER THAN WHAT I WAS CURRENTLY RISKING; RAISING MY STOP LOSS MEANS I CAN BUY ADDITIONAL SHARES, THUS LOWERING MY AVERAGE ENTRY PRICE, WHILE KEEPING GOOD RISK MANAGEMENT!) --------- manage my trades by raising my RISK LEVEL (raise my STOP LOSS), which would then enable me to add more shares to my current open position, based on the SHARES I TOOK with my risk initially being lower, serving as a fraction of the TOTAL POSITION SIZE I AM ABLE TO ACTUALLY TAKE were i to raise my risk/stop loss level! ------- Trading Tickers 2 – Chapter 7 -------- https://members.timothysykes.com/lessons/trading-tickers-2-chapter-7 ....... #RiskMgmt
Pattern set up:
Day 1:
a big %GAINER (is a First Green Day)
good CATALYSTheavy FLOAT ROTATIONit HELD ITS GAINS/closes near its HIGHShot sector (including being a Biotech)
Day 2:
holds evenly / consolidates (this lures in the short-sellers)IF IT TANKS ON DAY 2, THEN IGNORE IT ON DAY 3
Day 3:
a breakout above Day 2 highs (this is the panic point for shorts #short-squeeze)great if its FRIDAYhigh volumehot sectorheavy float rotation
_______________________________________________________
Keys (keys to heed when trading the pattern)
* if the stock is a BIOTECH, the DAY 3 surge pattern has the potential to perform well.
* set my alert near the highs of the breakout level.
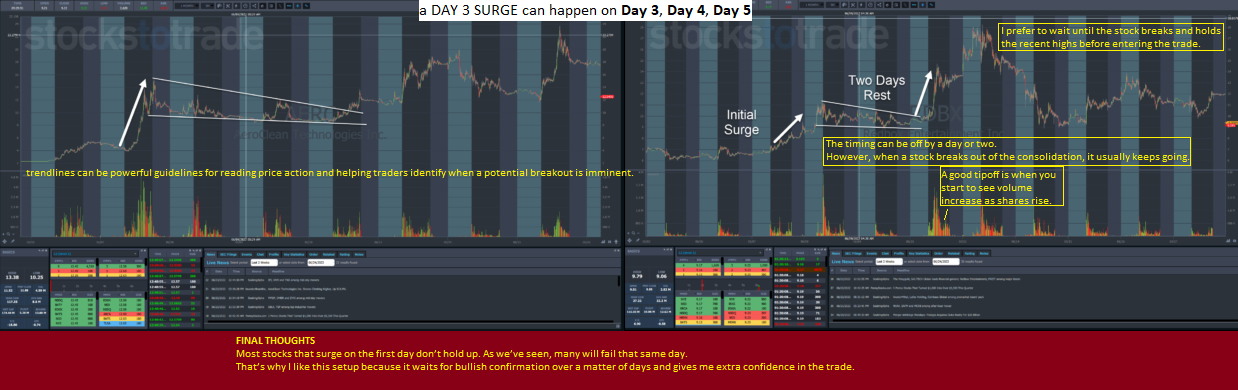
* the 'day 3' surge can happen on Day 3, Day 4, or Day 5, especially on FRIDAYS.
* if the stock tanked on Day 2, then ignore it on Day 3.
* The Day 3 Surge has the potential to play out within at least 5 trading days after the stock is on the %Gains (on Day 1). if it hasn't spiked in that much time, you can probably delete your alert and move on...
Typically, in order to trap the shorts(to get the short-squeeze), it's gotta get follow-through spiking momentum in a few days.. if you don't get that spike in less than 5 days, odds are it's not going to happen and you can move on.
THE FRONT SIDE OF THE STOCK'S MOVE USUALLY HAPPENS CONTINUALLY WITHIN 5 DAYS... UNLESS A NEW CATALYST COMES INTO PLAY AFTER DAY 5.... OTHERWISE, BY DAY 6, DAY 7, DAY 8, THE STOCK IS ON IT'S BACKSIDE AND IS A SHORT.
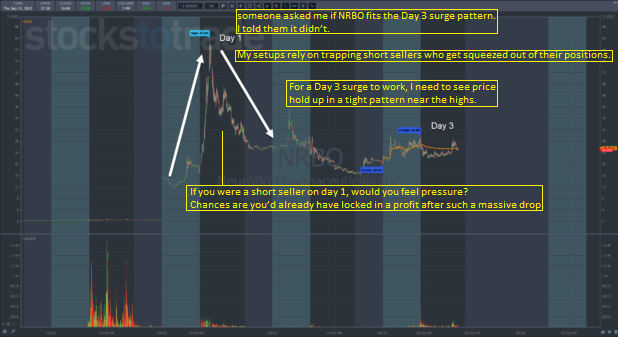
* In order for a day 3 surge to occur, I want short sellers to get nervous. The best way for this to occur is through consolidation near the highs.
Step 1: On FRIDAYS, run my scanner to see what the %GAINERS ON WEDNESDAY WERE.....
Step 2: view the charts to see if the stocks held their gains on THURSDAY....
Step 3: refer to the DAY 3 criteria above if Step 1 and Step 2 are valid.
WHY IT'S GREAT IF THE STOCK IS A BIOTECH
99% of BIOTECHS have one day spikes and then crater the next day... And then it's over (they never come back, or they come back two years later). So if a Biotech on Day 2 (after it's spiked big on Day 1) HOLDS IT'S GAINS on Day 2, then that baits in the short-sellers, providing for a potential short-squeeze on DAY 3 (especially if its a Friday).
WHAT TO DO AFTER A THIRD GREEN DAY --- typically you need higher volume to break-out to newer highs... The higher the volume the better it is.... However, if the stock is over-extended, and to short into the stock, watch Min 3:42:00 of "Part 2 ORIGINAL" vid #DuxDVD...
_______________________________________________________
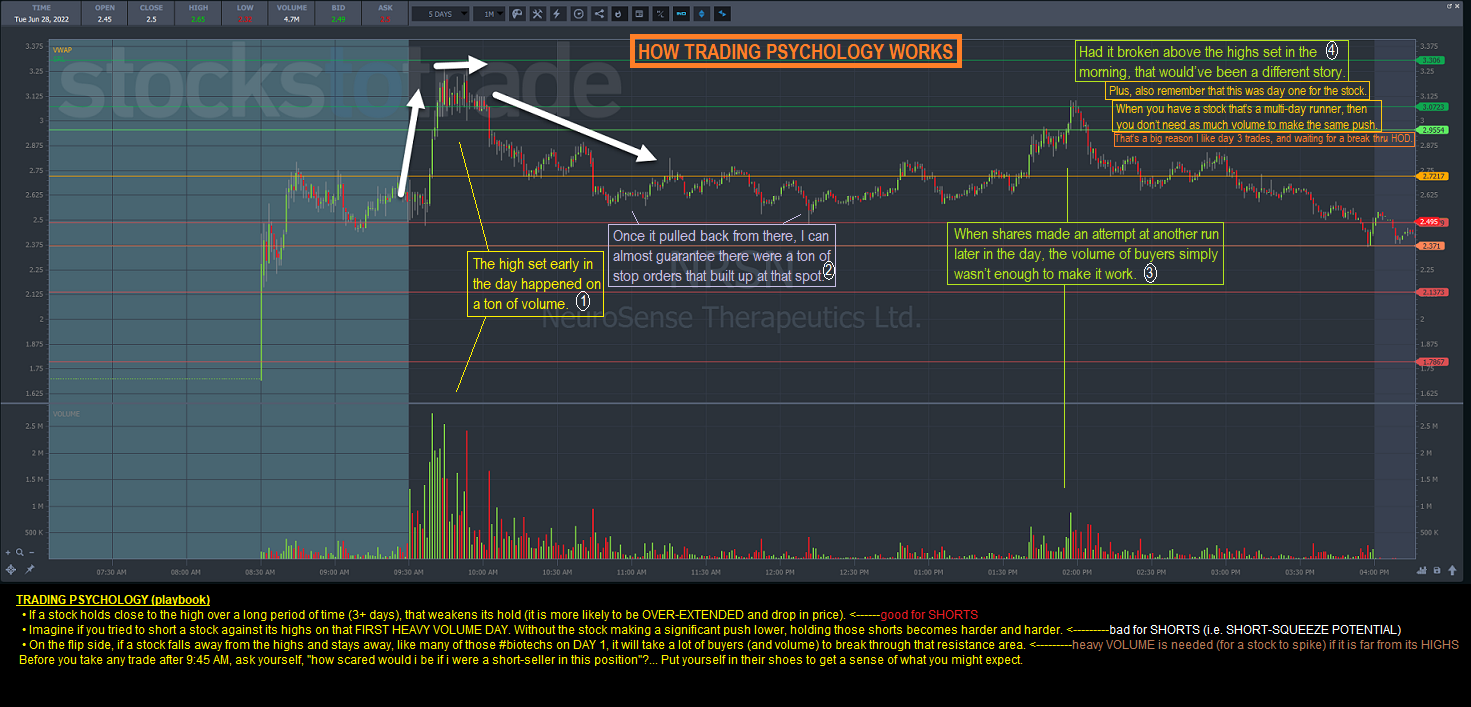
TRADING PSYCHOLOGY (playbook)
• If a stock holds close to the high over a long period of time (3+ days), that weakens its hold (it is more likely to be OVER-EXTENDED and drop in price). <------good for SHORTS
• If a stock tanks (like many #biotechs on DAY 1), it will take a lot of buyers (volume) to break through resistance. <------heavy VOLUME is needed (for it to spike) if it's far from its HIGHS
Before you take a trade, ask yourself, "how scared would i be if i were a short-seller in this position"?... Put yourself in their shoes to get a sense of what you might expect. -Bohen
Min 37 ------ How to ensure a massive supernova spiker doesn't have many bagholders still in the stock (so it can keep spiking instead of selling off and tanking due to bagholders selling to break-even or minimize the amount of losses they're holding) ----- youtube.com/watch?v=zvs_8zF-i1E ..
SCANNER (for finding the pattern)
STEP 1
Day 3 Surge scan criteria:
• % change: greater than 30% (>30% gain)
• Volume: more than 1,000,000 shares (>1m+ volume)
• Avg 10-day volume: less than 100,000 (<100,000 volume over 10-days)
Optional criteria:
• Float: less than 10,000,000 (<10m float)• Last stock price: less than $10 (<$10)
STEP 2
From there, delete any stocks that don’t have a:
• Significant increase in volume over the average
• News catalyst
STEP 3
Run through the charts, and make sure the stocks didn’t break through the highs and they held the high and tight pattern... IF the stock already had a breakout, or tanked below its highs, take it off the list.
______________________________________
On WEDNESDAYS, i ought to notate which stocks were First Green Days (with news, high volume, heavy float rotation).
on THURSDAYS, these stock's ought to then consolidate.
on FRIDAYS, these stocks ought to then BREAKOUT above highs for SHORT-SQUEEZE POTENTIAL.
the stock is a BIOTECH.
_______________________________________________________
Stat tracking (stats and columns to track, for the pattern)
Only track the STOCKS that successfully played the pattern out! this way i can look for the multiple similarities the "successful" stocks had with one another, and find consistencies in the probabilities behind a pattern's success.... Then create RULES to follow (based on the factors that the stock ought to possess (i.e. low float, etc.).
FOR ALL PATTERNS, I MUST:
1. track the average gain (the average gain possible across 100+ samples) --- tells me when best to take profits (so i don't get greedy; gives confidence in holding my position optimally).
2. track the top tick % (what is the avg top tick ($) across 100+ samples) --- tells me when it is best to enter the trade.
3. track the bottom tick % (what is the avg bottom tick ($) across 100+ samples) --- tells me when it is best to exit the trade.
I CAN ADD [SPIKEET] TO MY EXCEL SPREADSHEETS BY USING THE "SPIKEET PLUGIN" TO RETRIEVE STOCK MARKET DATA FOR ME -------- www.twitter.com/_spikeet/status/1567826513915006976?s=20 ......... https://bit.ly/3xB4seL ......... #SPIKEET #EXCEL
As a beginner trader, narrow your entire trading to one or two patterns so you can just FOCUS on those patterns... Then improve your entry and exit points to make this pattern PERFECT based on your performance... Experienced traders know where they're going to enter and exit. Beginner traders do not have enough data to back up their thesis. This is the major difference between experienced and beginner traders... -Dux
__________________________________________
- track what the market cap is (the lower the market cap, the better for spiking).
- track what the float is (the lower the float, the better for spiking).
- FIND WITH WHAT SECTIONS [MARKETCAP/FLOATS] DAY 3 SURGES HAPPEN BEST WITH.
- track FLOAT ROTATION is (the greater the float rotation, the better; 3x-10x = bullish.
- is the stock a BIOTECH? (great, if so).
- did the stock CONSOLIDATE / PERFORM WEAK on DAY 2 (after it SPIKED / hit %Gains lists on Day 1).
- is it a past runner (has spiked 100+% in the past year?)
- did the stock (on Day 3) breakout over the LAST TWO DAYS' HIGHS? or did it breakout only above the last DAY'S HIGH? the more days of resistance it breaks out of and above, the better! because a "multi-day breakout" is much stronger of a momentum move than a "intraday breakout".
- When tracking VOLUME, always track both of these:::::: [VOLUME in premarket] and [VOLUME end of day].......
- What was the stock's OPEN price?
- What was the stock's CLOSE price?
- What was the stock's HIGH TICK price?
- What was the stock's LOW TICK price?
______________________________________________________
review all the content in this spreadsheet to help me with tracking
______________________________________________________
I ALREADY WATCHED EVERYTHING BELOW!
DAY 3 SURGE
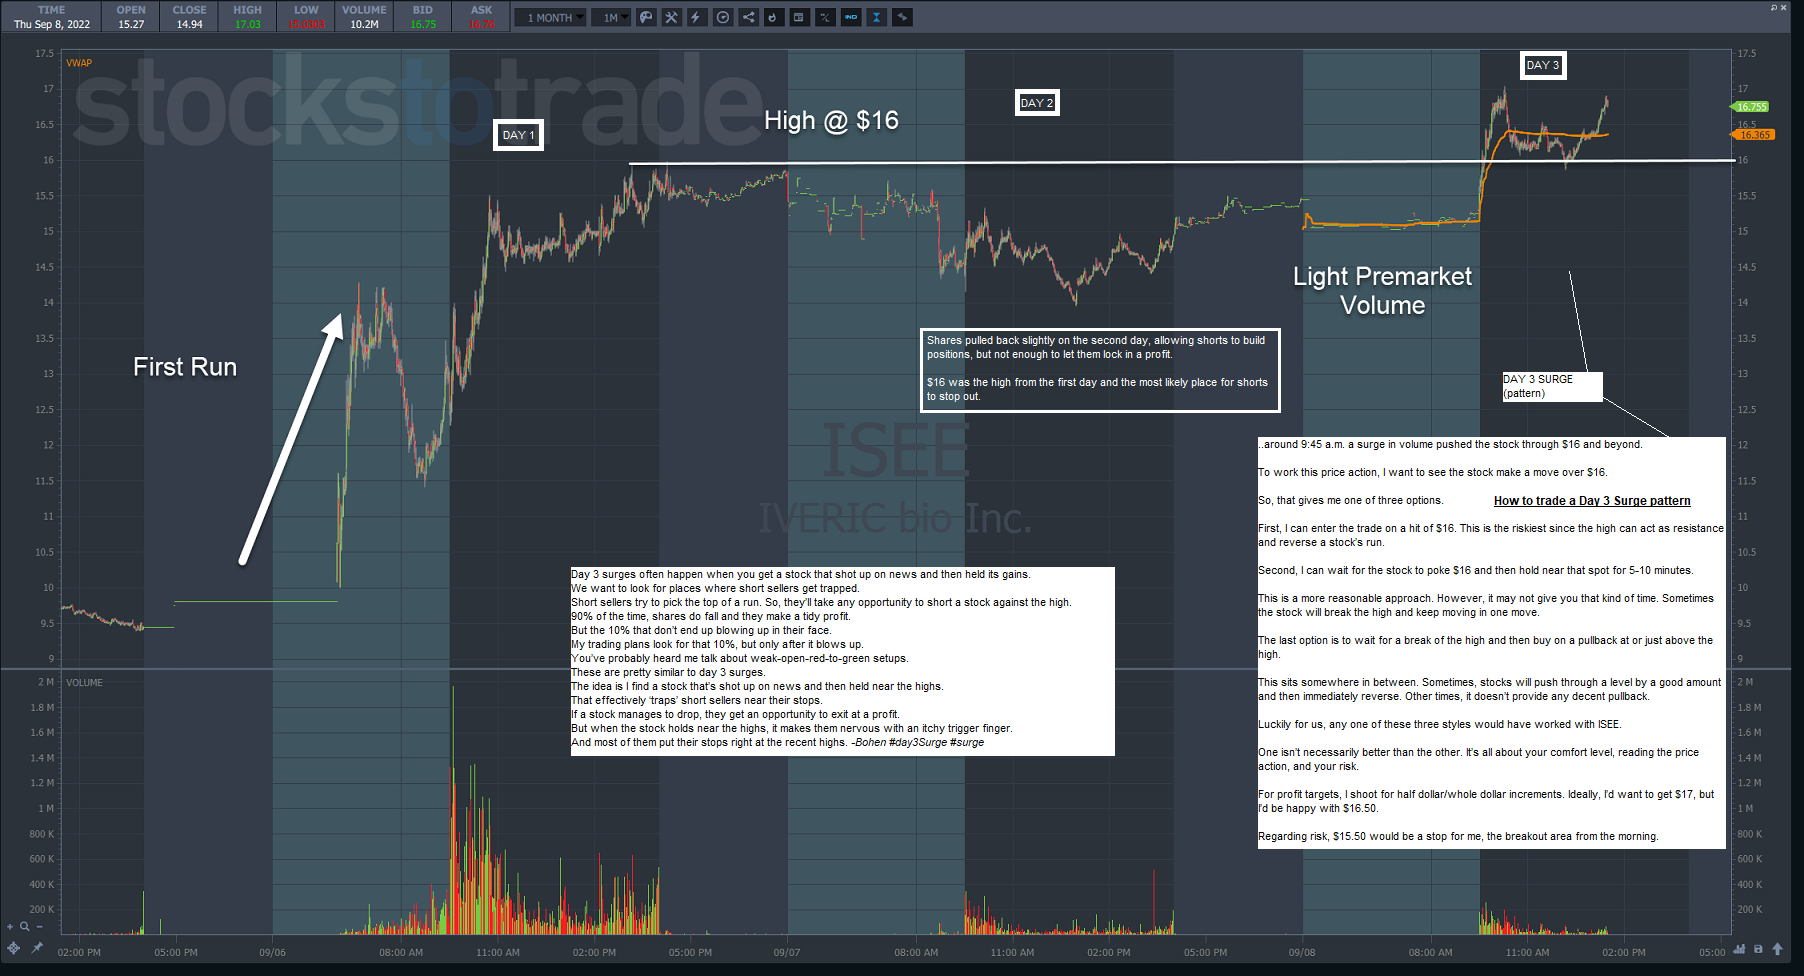
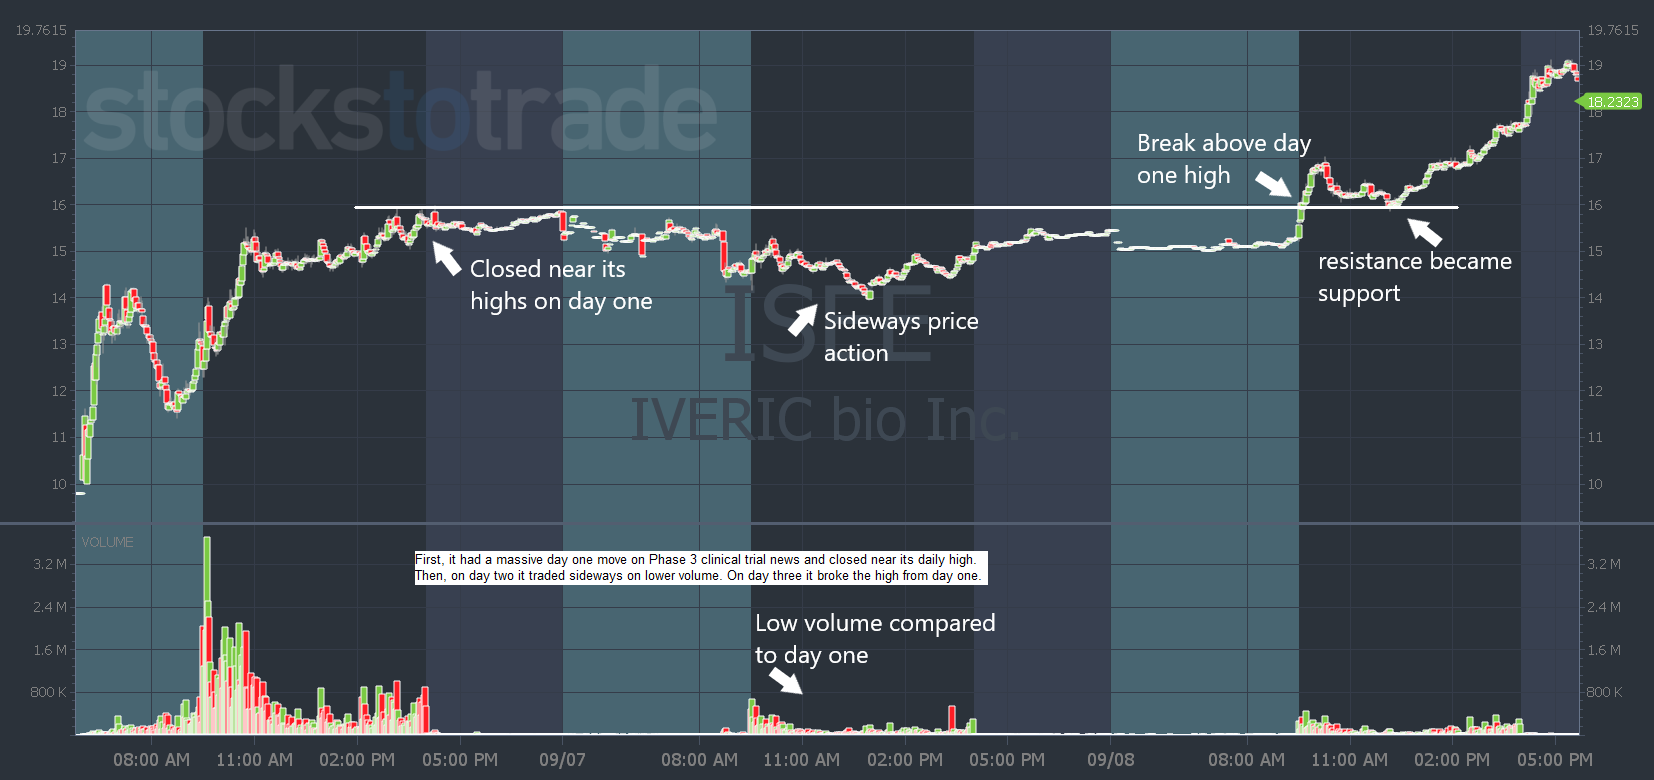
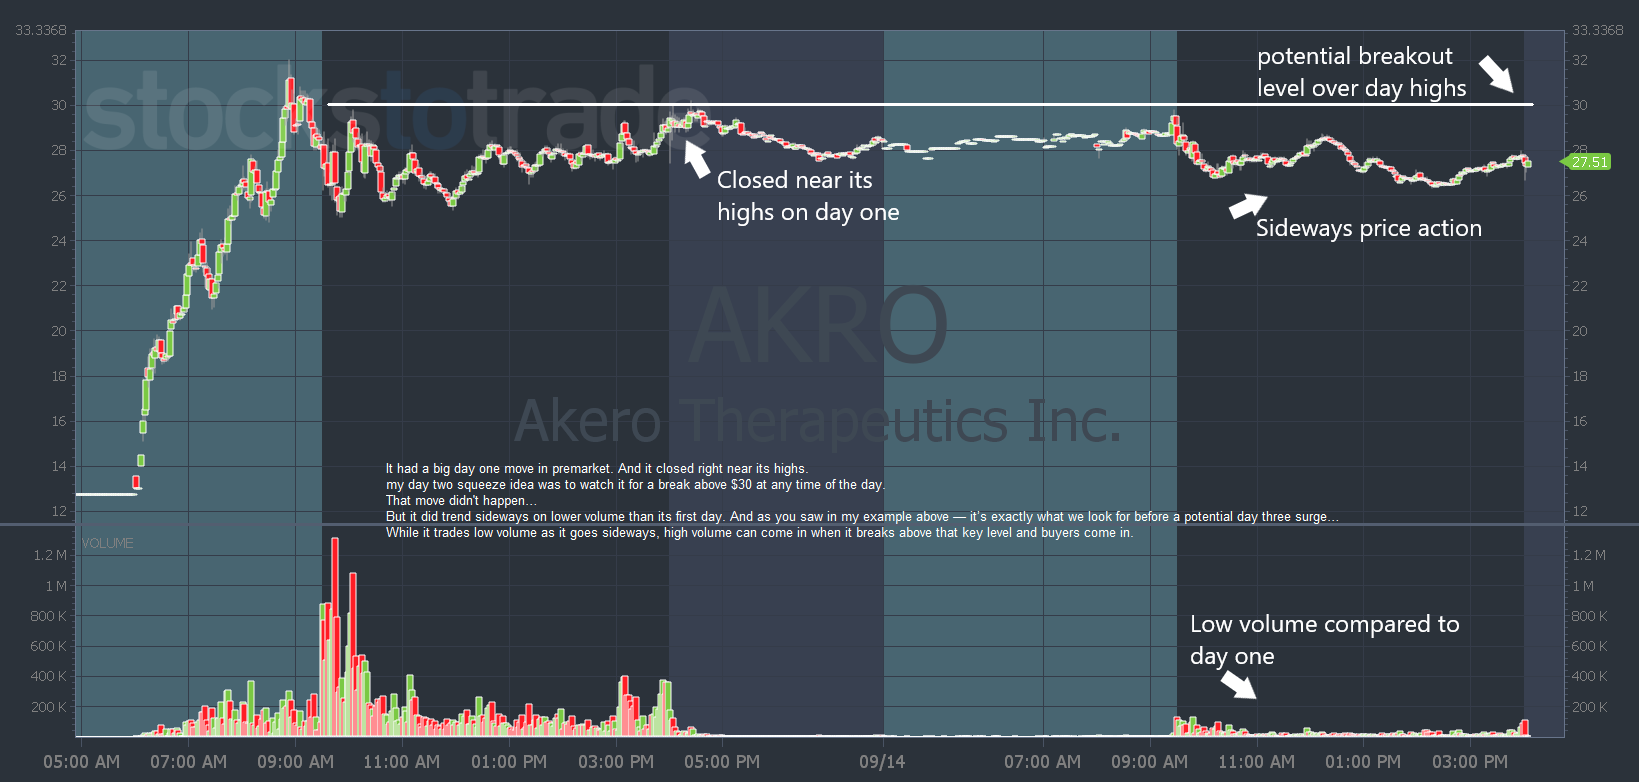
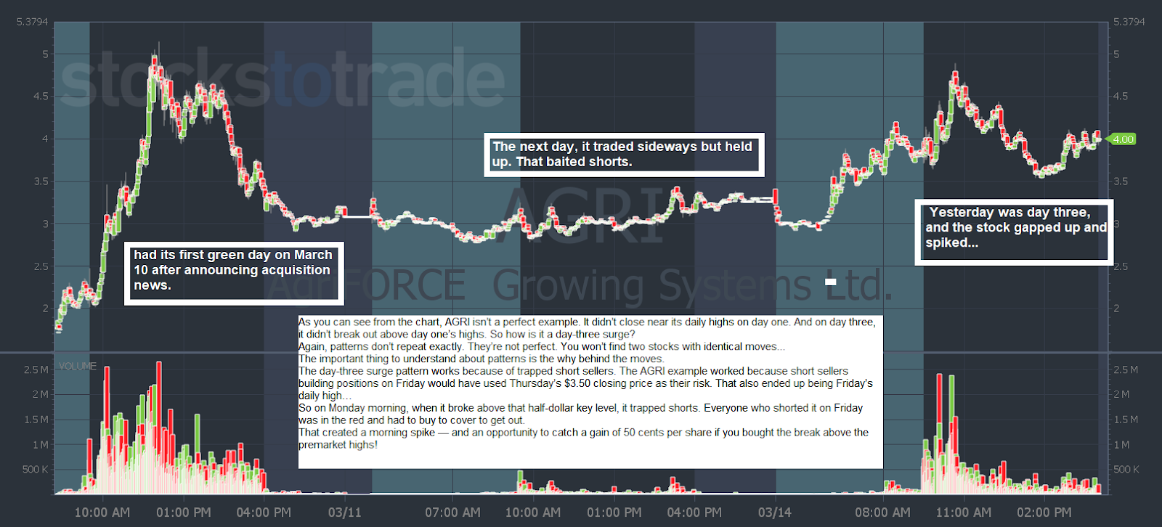
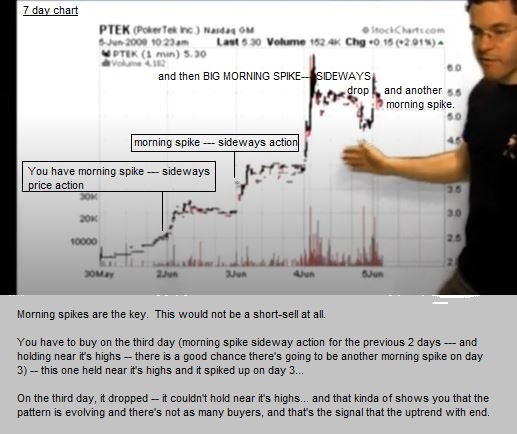
Day 1: The first thing you want to see is a big percent gainer on day one. This is a stock with news, high volume, and float rotation. Ideally, it closes near its daily highs and has a big first green day.
Day 2: Next, you want it to do nothing. There’s no trade on day two. You just want to see the stock chop sideways but still hold up. That traps short sellers. They don’t get the big drop they’re anticipating, so they don’t buy to cover…
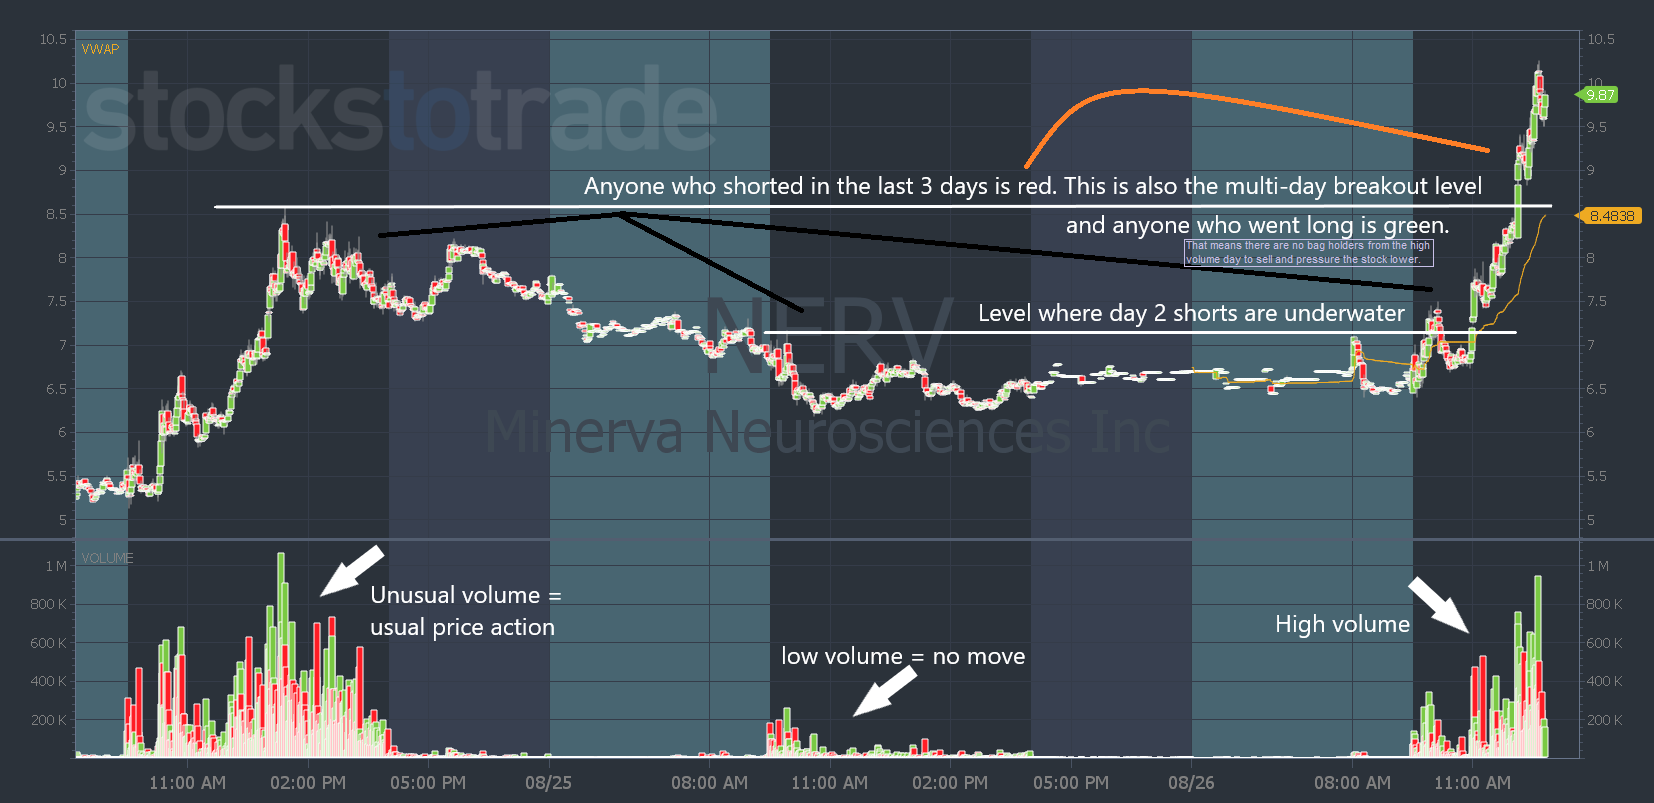
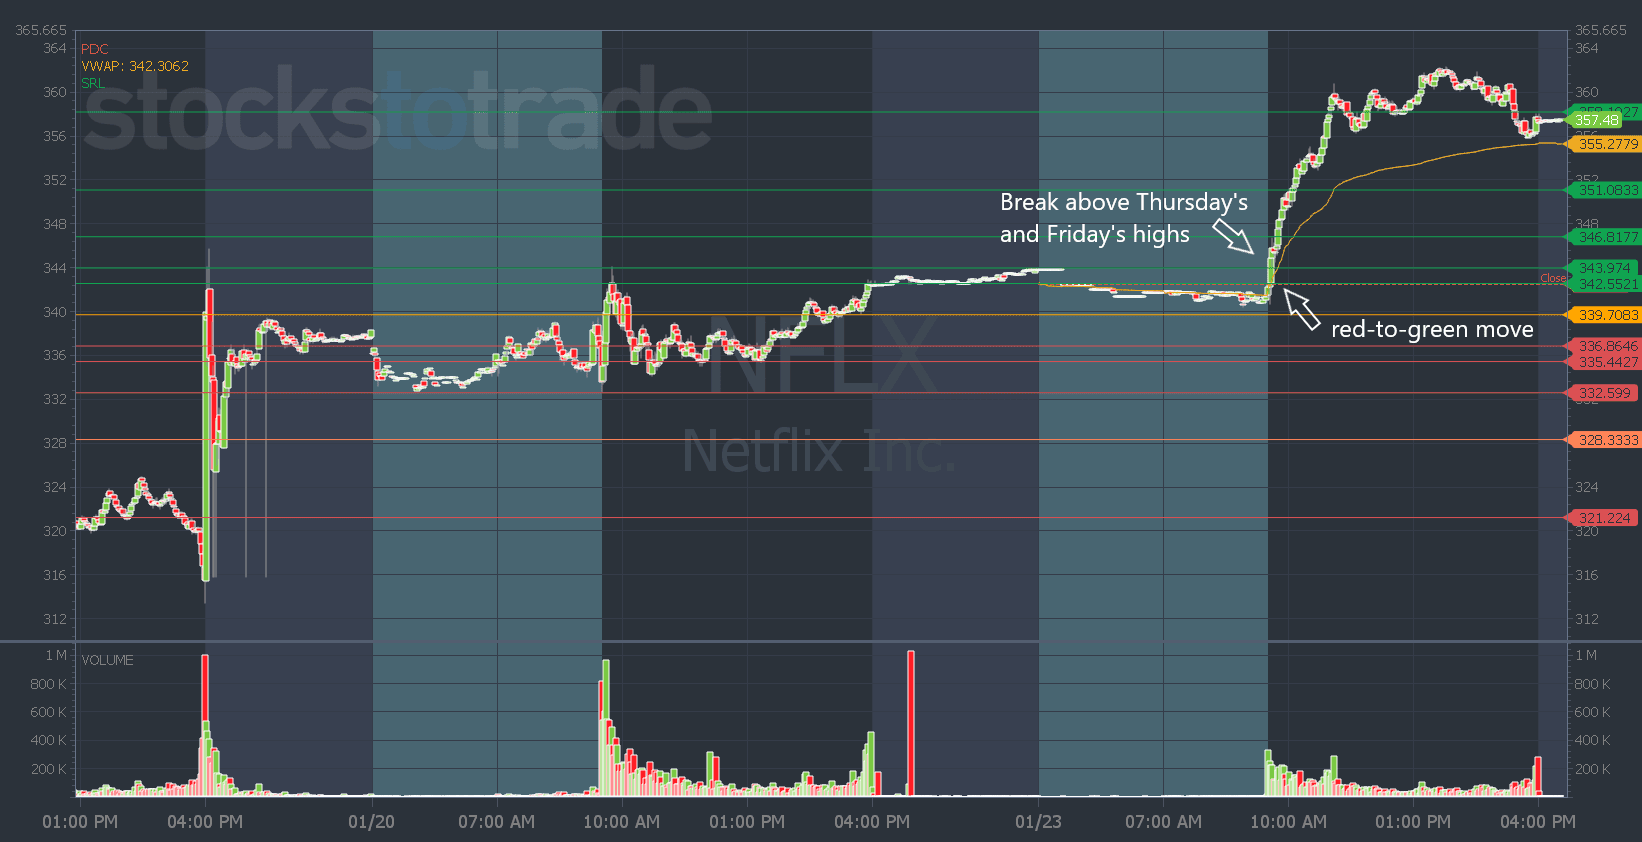
Day 3: Then on day three, you want the stock to break above its day-two and, ideally, day-one highs. That’s the panic point for shorts because they typically use recent highs as a risk level. And when a stock breaks above those levels, long traders are green on their positions while shorts are red.
the DAY 3 SURGE pattern doesn’t have to happen specifically on day three…
It can happen on day four or five. The day three surge is the pattern and price action we’re looking for. It’s not about what day the move happens.
What we want to see is a stock that has a huge day one run. Then for it to hang around on day two or three. And the next day, I want it to dip near the open and reverse to the upside for an explosion through the day one high!
The goal of trading this pattern is to take advantage of short sellers who haven’t covered yet. -Bohen
THE TYPE OF NEWS CATALYST TO LOOK FOR ON A DAY 3 SURGE PATTERN
I want the move to come on positive, real news that materially helps the company.
For biotechs, that can be trial results or FDA approval.
For tech stocks, it could be a major client contract or purchase.
What I don’t want to see is a move on some garbage about a CEO presenting at a conference.
Min 5 ---------- on Day 2 the stock typically consolidates and perform weak (no moves up or down; plain old sideways action that lures in the shorts), causing DAY 3 SURGE (a break of the two previous days highs (a breakout (with GOOD VOLUME) above the PAST TWO DAYS' chart resistance) | if it is a FRIDAY that makes the Day 3 Surge an even better probability for the pattern to play out ---------- www.youtube.com/watch?v=yUcI-8jzc38 .........
WHERE TO SET MY STOP LOSS FOR THE DAY 3 SURGE PATTERN--------------- Set your risk at the Day 2 high (in other words, set the stop loss at the resistance levels that formed on Day 2)... the day 2 highs would be considered as SUPPORT on Day 3....... or risk VWAP.......... or risk the nearest WHOLE DOLLAR / HALF DOLLAR level.....or risk the PREVIOUS DAY'S CLOSE.........
Min 11:15 ------- THE DAY 3 SURGE PATTERN ----------------- www.youtube.com/watch?v=yUcI-8jzc38 ............
[Day 1: Is a big gainer on DAY 1, with a good news catalyst, and it holds all of it's gains by the end of the Day 1]
[Day 2: holds evenly and consolidates (performs 'weak/average' basically)]
[Day 3 (surge day): followed by a break of the highs on DAY 3, perks up / breaks-out / short-squeezes (if it's a Friday, that's even better as it scares shorts out of their positions, squeezing the stock higher]. set your STOP LOSS at Day 2's high of day --- Day 2's high of the day will serve as SUPPORT on Day 3...
The day 3 surge can happen on Day 3, Day 4, or Day 5.... --- especially on FRIDAYS | set my alerts near the highs of the breakout level on DAY 3! ------- www.youtube.com/watch?v=GFg7QaJDs5M ............
If the stock TANKS on Day 2, then ignore it on Day 3...........
The day 3 surge has the potential to play out within at least 5 trading days.. if it hasn't spiked in that much time, you can probably delete your alert and move on... Typically, in order to trap the shorts(to get the mania), it's gotta get follow-through spiking momentum in a few days-- otherwise, after that, day traders are fickle, markets are fickle, there's always a new hot sector --- there's always a new stock......... if you don't get that spike in less than 5 days, odds are it's not going to happen and you can move on......... -Bohen..........
THE FRONT SIDE OF THE STOCK'S MOVE USUALLY HAPPENS CONTINUALLY WITHIN 5 DAYS........ UNLESS A NEW CATALYST COMES INTO PLAY AFTER DAY 5.......... OTHERWISE, BY DAY 6, DAY 7, DAY 8, THE STOCK IS ON IT'S BACKSIDE AND IS A SHORT..... -Bohen commentary
KEYS TO A SUCCESSFUL DAY 3 SURGE
has a catalyst
is in a hot sector
is trading unusual volume
Min 5 ------ Bohen explaining how BioTechs on Day 2 typically consolidate and perform weak | that lures in the shorts, causing DAY 3 SURGE (a break of the highs) ------- www.youtube.com/watch?v=yUcI-8jzc38 ..... yoooo, I GOTTA LOOK TO PLAY DAY 3 SURGES ON A CONSISTENT BASIS --- FIND WITH WHAT MARKETCAP/FLOATS DAY 3 SURGES HAPPEN BEST WITH!....... TRACK ALL STOCKS THAT HAVE POTENTIAL TO HAVE DAY 3 SURGES AND MAKE THIS ONE OF MY STRATEGIES!.......
99% of BIOTECHS have one day spikes and then crater the next day... And then it's over (they never come back, or they come back two years later). So if a Biotech on Day 2 (after it's spiked big on Day 1) HOLDS IT'S GAINS on Day 2, then that baits in the short-sellers, providing for a potential short-squeeze on DAY 3 (especially if its a Friday). #biotechs
Min 7:40 ---------- a Day 3 Surge type of setup to look for (day 1 good, day 2 bad/weak, day 3 huge surge) -------- www.youtube.com/watch?v=m07CX1jR3Kg .......... #Day3Surge
WHAT TO DO AFTER A THIRD GREEN DAY --- typically you need higher volume to break-out to newer highs... The higher the volume the better it is.... However, if the stock is over-extended, and to short into the stock, watch Min 3:42:00 of "Part 2 ORIGINAL" vid #DuxDVD...
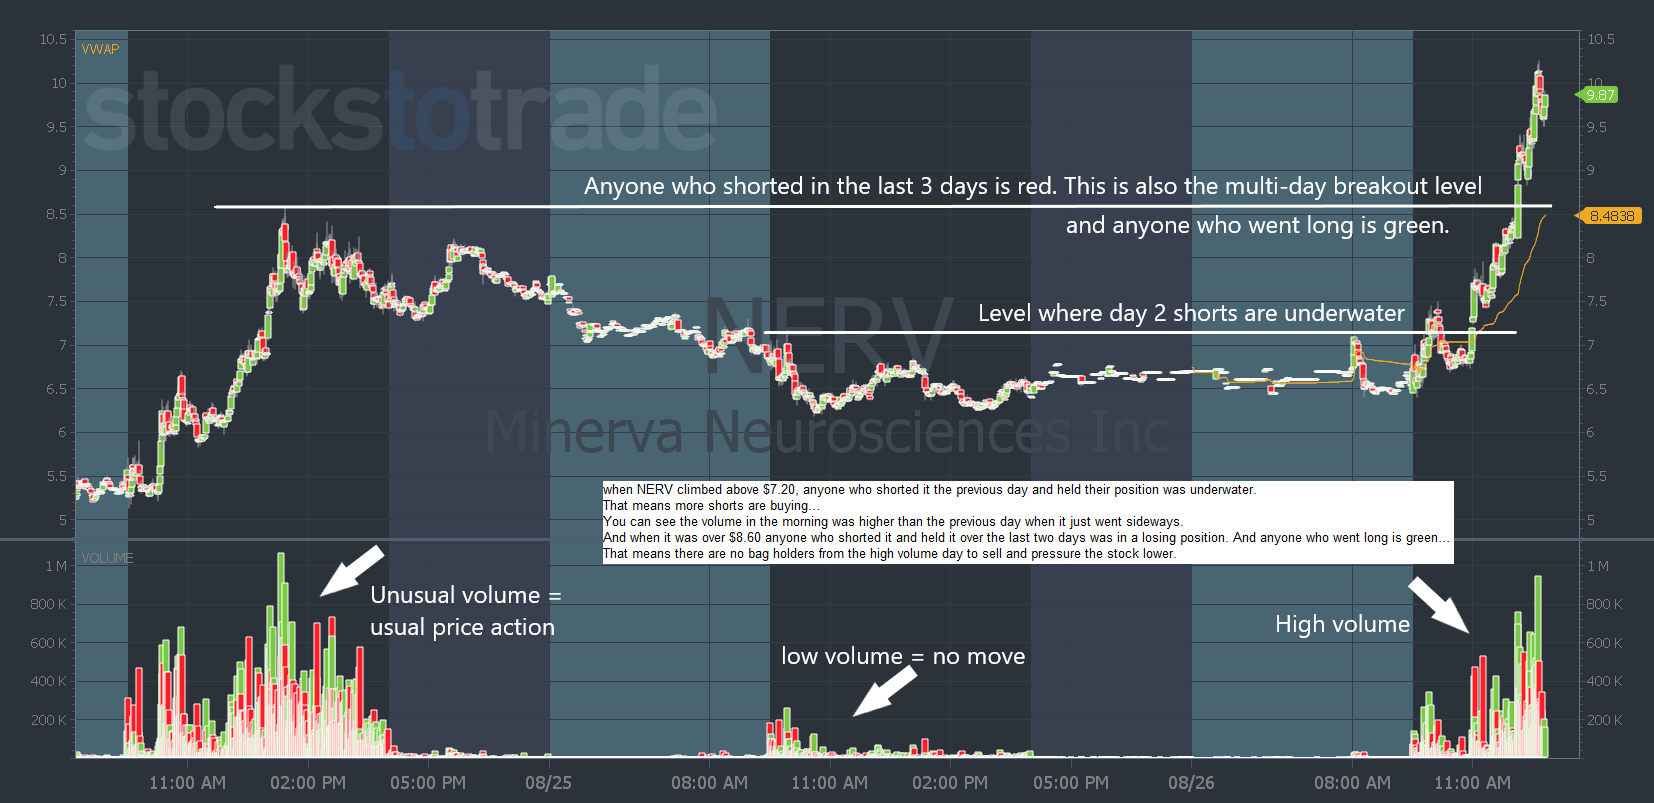
Day 3 surges often happen when you get a stock that shot up on news and then held its gains. -Bohen
we want to look for places where short sellers get trapped.
Short sellers try to pick the top of a run. So, they’ll take any opportunity to short a stock against the high (the high being their stop loss/risk level).
90% of the time, shares do fall and they make a nice profit.
My trading plans look for that 10%.
You’ve probably heard me talk about weak-open-red-to-green setups.
These are pretty similar to day 3 surges.
The idea is I find a stock that’s shot up on news and then held near the highs.
That effectively ‘traps’ short sellers near their stops.
If a stock manages to drop, they get an opportunity to exit at a profit.
But when the stock holds near the highs, it makes them nervous with an itchy trigger finger.
And most of them put their stops right at the recent highs. -Bohen #day3surge #surge #worg
ALREADY READ!!!!!!!!!!!
- https://stockstotrade.com/the-day-three-surge-pattern/?email=saloul10%40gmail.com ...........
- https://university.stockstotrade.com/2022/06/27/day-3-surge/?utm_source=iterable&email=saloul10%40gmail.com ...........
- https://university.stockstotrade.com/2022/09/16/day-3-surge-dos-and-donts/?utm_source=iterable&email=saloul10%40gmail.com .............
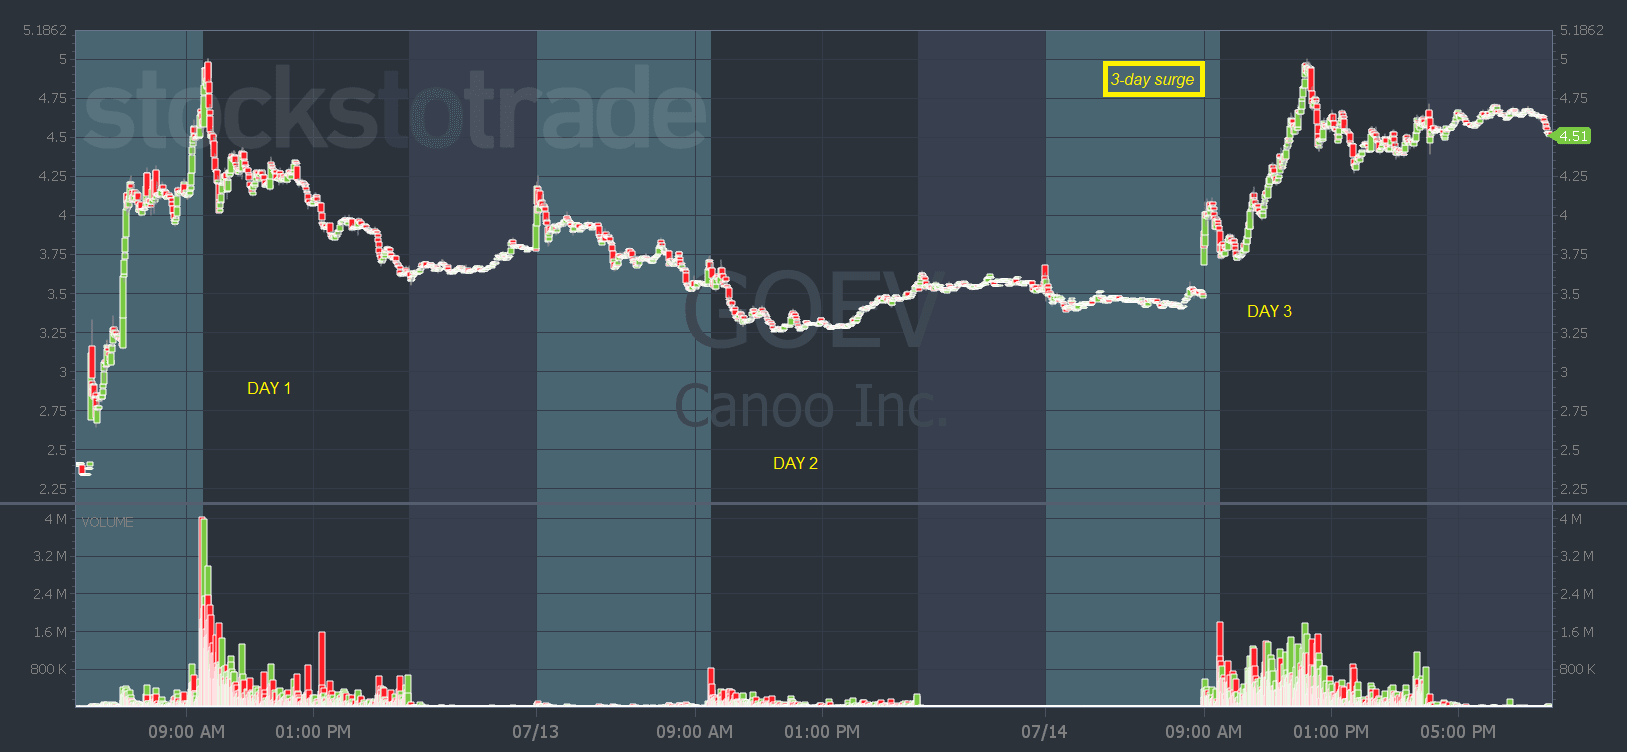
The day-three surge is a pattern that plays out over three days
1. On day one, it’s a big gainer with substantial news.
2. On day two, it draws in shorts, and then.
3. On day three, it breaks its highs.
Day 1: Look for a big gainer with substantial news that holds all of its gains.
Day 2: Today’s the day to look for short-baiting action. They think it’s gonna break down — but if it doesn’t, they’re stuck and don’t have a place to exit.
Day 3: If it breaks the highs, it could run!
With a Day Three Surge pattern, we look for a breakout above the high from the stock’s first green day. -Bohen #Day3Surge
TRADING PSYCHOLOGY (playbook)
• If a stock holds close to the high over a long period of time (3+ days), that weakens its hold (it is more likely to be OVER-EXTENDED and drop in price). <------good for SHORTS
• Imagine if you tried to short a stock against its highs on that FIRST HEAVY VOLUME DAY. Without the stock making a significant push lower, holding those shorts becomes harder and harder. <---------bad for SHORTS (i.e. SHORT-SQUEEZE POTENTIAL)
• On the flip side, if a stock falls away from the highs and stays away, like many of those #biotechs on DAY 1, it will take a lot of buyers (and volume) to break through that resistance area. <------------heavy VOLUME is needed (for a stock to spike) if it is far from its HIGHS
Before you take any trade after 9:45 AM, ask yourself, "how scared would i be if i were a short-seller in this position"?... Put yourself in their shoes to get a sense of what you might expect. -Bohen #TradingPsychology #ImportanceOfVolume #short-squeezes #squeezes
When a stock consolidates (on Day 2), after a monster run (on Day 1), this tells me traders are accumulating positions [otherwise, we would have seen the stock start to fall apart]. -Bohen #day3Surge
how to find a DAY 3 #SURGE ---------- https://twitter.com/StocksToTrade/status/1615062702660980760?s=20&t=2iC6N8jllhR2vX1RFMwA2A ............ #tuohey #day3Surge
Min 10:55 — rationale behind the day 3 surge psychology — https://m.youtube.com/watch?v=JRDcZr0bVko …..
Min 22:55 --------- HOW TO MANAGE MY TRADE (I.E. RAISE MY STOP LOSS HIGHER IF THE TAPE IS HOLDING A LEVEL HIGHER THAN WHAT I WAS CURRENTLY RISKING; RAISING MY STOP LOSS MEANS I CAN BUY ADDITIONAL SHARES, THUS LOWERING MY AVERAGE ENTRY PRICE, WHILE MAINTAINING GOOD RISK MANAGEMENT!) --------- manage my trades by raising my RISK LEVEL potentially (raising my STOP LOSS), which would then enable me to add more shares to my current open position, based on the SHARES I TOOK with my risk initially being lower, serving as a fraction of the TOTAL POSITION SIZE I AM ABLE TO ACTUALLY TAKE were i to raise my risk/stop loss level! ------- Trading Tickers 2 – Chapter 7 -------- https://members.timothysykes.com/lessons/trading-tickers-2-chapter-7 ......... #RiskMgmt
Min 20:40 ----- Min 30:30 ----- Min 36 ----- Min 50 ----- Min 58 -------------- A great video explaining how BAGHOLDERS and VOLUME influence the stock's technical analysis ------------ How to ensure a massive supernova doesn't have many bagholders still in the stock (so it can keep spiking instead of selling off and tanking due to bagholders selling to break-even or minimize the amount of losses they're holding ---------------- if a stock has a HUGE RED CANDLE with a HUGE RED VOLUME BAR underneath it, that means it was likely BAGHOLDERS who were SELLING off. There are always more BUYERS than SELLERS(including short-sellers) in the market -------------- www.youtube.com/watch?v=zvs_8zF-i1E ........... #bagholders #stephenJohnson #gappers #gapAndCrap #Gap&Crap
WHY DOES DAY 3 MATTER?
For a stock that had a FGD, if it can hold its gains on day 2, and sit near the highs, there’s a good chance traders push price over the recent highs & create another short squeeze. -Bohen #Day3Surge